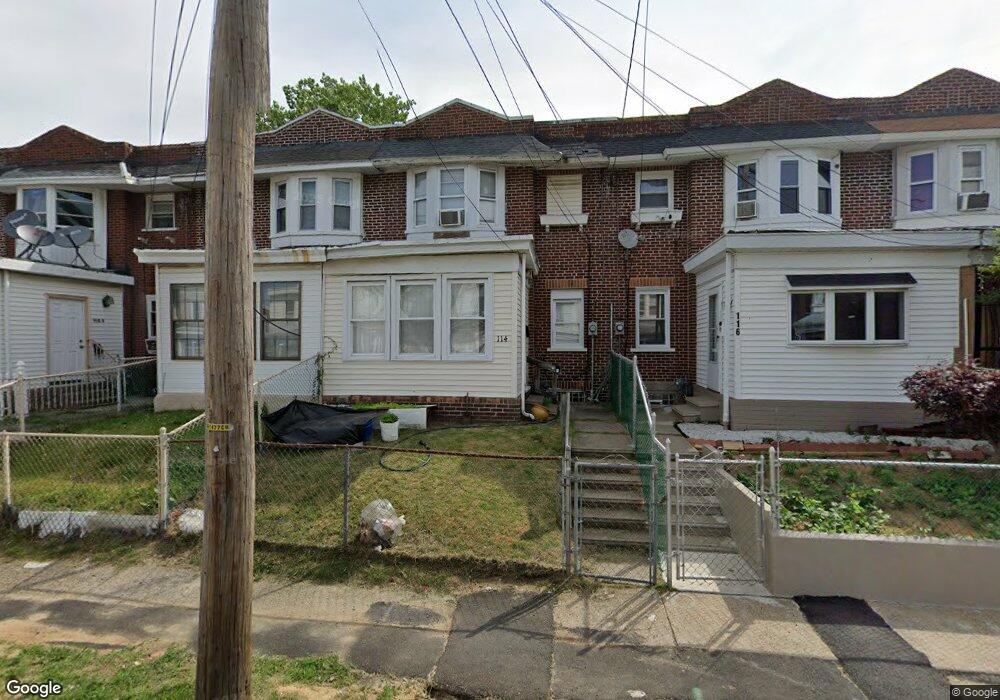
114 S 27th St Camden, NJ 08105
Stockton NeighborhoodEstimated Value: $140,000 - $181,000
--
Bed
--
Bath
1,140
Sq Ft
$140/Sq Ft
Est. Value
About This Home
This home is located at 114 S 27th St, Camden, NJ 08105 and is currently estimated at $159,064, approximately $139 per square foot. 114 S 27th St is a home located in Camden County with nearby schools including Alfred Cramer College Preparatory Lab School, Eastside High School, and St Joseph Pro-Cathedral School.
Ownership History
Date
Name
Owned For
Owner Type
Purchase Details
Closed on
Jan 13, 2003
Sold by
Jimenez Maria G
Bought by
Pham Tung V
Current Estimated Value
Home Financials for this Owner
Home Financials are based on the most recent Mortgage that was taken out on this home.
Original Mortgage
$38,000
Outstanding Balance
$16,176
Interest Rate
5.99%
Estimated Equity
$142,888
Purchase Details
Closed on
Oct 5, 2001
Sold by
Federal Home Loan Mtg Corp
Bought by
Pagan Ana L
Purchase Details
Closed on
May 24, 1995
Sold by
Federal Housing Administration
Bought by
St Josephs Carpenter
Create a Home Valuation Report for This Property
The Home Valuation Report is an in-depth analysis detailing your home's value as well as a comparison with similar homes in the area
Home Values in the Area
Average Home Value in this Area
Purchase History
| Date | Buyer | Sale Price | Title Company |
|---|---|---|---|
| Pham Tung V | $40,000 | -- | |
| Pagan Ana L | $16,000 | -- | |
| St Josephs Carpenter | $25,000 | -- |
Source: Public Records
Mortgage History
| Date | Status | Borrower | Loan Amount |
|---|---|---|---|
| Open | Pham Tung V | $38,000 |
Source: Public Records
Tax History Compared to Growth
Tax History
| Year | Tax Paid | Tax Assessment Tax Assessment Total Assessment is a certain percentage of the fair market value that is determined by local assessors to be the total taxable value of land and additions on the property. | Land | Improvement |
|---|---|---|---|---|
| 2025 | $2,392 | $67,500 | $15,700 | $51,800 |
| 2024 | $2,312 | $67,500 | $15,700 | $51,800 |
| 2023 | $2,312 | $67,500 | $15,700 | $51,800 |
| 2022 | $2,269 | $67,500 | $15,700 | $51,800 |
| 2021 | $2,094 | $67,500 | $15,700 | $51,800 |
| 2020 | $2,147 | $67,500 | $15,700 | $51,800 |
| 2019 | $2,055 | $67,500 | $15,700 | $51,800 |
| 2018 | $2,045 | $67,500 | $15,700 | $51,800 |
| 2017 | $1,995 | $67,500 | $15,700 | $51,800 |
| 2016 | $1,931 | $67,500 | $15,700 | $51,800 |
| 2015 | $1,859 | $67,500 | $15,700 | $51,800 |
| 2014 | $1,814 | $67,500 | $15,700 | $51,800 |
Source: Public Records
Map
Nearby Homes
- 154 Eutaw Ave
- 2598 Baird Blvd
- 2937 Carman St
- 2709 Westfield Ave
- 100 E 28th St
- 2707 Westfield Ave
- 341 Marlton Ave
- 2817 Westfield Ave
- 2621 Westfield Ave
- 355 S 27th St
- 2933 Royden St
- 420 Boyd St
- 2934 Cramer St
- 32 N 25th St
- 3001 Royden St
- 3075 Stevens St
- 402 S 30th St
- 477 Rand St
- 363 Garden Ave
- 444 Pfeiffer St