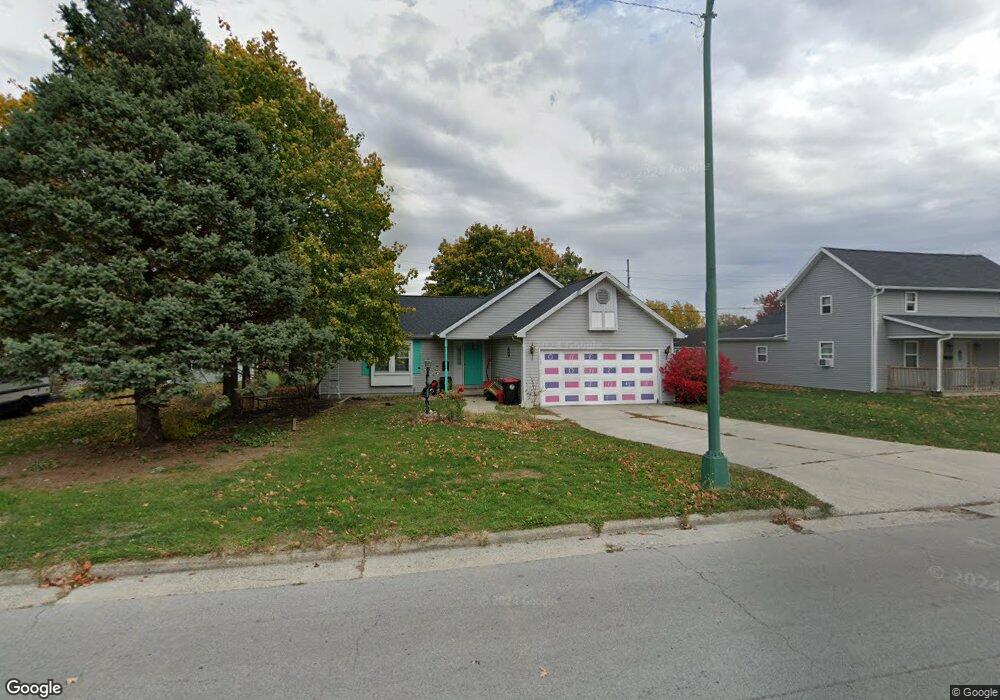
114 S Wagner Ave Wapakoneta, OH 45895
Estimated Value: $181,000 - $191,000
2
Beds
2
Baths
1,288
Sq Ft
$143/Sq Ft
Est. Value
About This Home
This home is located at 114 S Wagner Ave, Wapakoneta, OH 45895 and is currently estimated at $184,736, approximately $143 per square foot. 114 S Wagner Ave is a home located in Auglaize County with nearby schools including Wapakoneta Elementary School, Wapakoneta High School, and Wapakoneta Middle School.
Ownership History
Date
Name
Owned For
Owner Type
Purchase Details
Closed on
Aug 3, 2015
Sold by
Holtzapple Kevin L and Holtzapple Keith B
Bought by
Lopez Erica E and Lopez Paden J
Current Estimated Value
Home Financials for this Owner
Home Financials are based on the most recent Mortgage that was taken out on this home.
Original Mortgage
$85,470
Outstanding Balance
$71,447
Interest Rate
6.12%
Mortgage Type
FHA
Estimated Equity
$113,289
Purchase Details
Closed on
May 21, 2003
Sold by
Bush Christine
Bought by
Bush Christine
Purchase Details
Closed on
Feb 13, 2003
Sold by
Holtzapple Harmon
Bought by
Bush Christine
Purchase Details
Closed on
Aug 26, 1991
Sold by
Lamarr Virginia
Bought by
Lamarr Virginia
Purchase Details
Closed on
May 2, 1991
Sold by
Thuman Todd J
Bought by
Lamarr Virginia
Purchase Details
Closed on
Aug 1, 1987
Create a Home Valuation Report for This Property
The Home Valuation Report is an in-depth analysis detailing your home's value as well as a comparison with similar homes in the area
Home Values in the Area
Average Home Value in this Area
Purchase History
| Date | Buyer | Sale Price | Title Company |
|---|---|---|---|
| Lopez Erica E | $90,000 | Northwest Title | |
| Bush Christine | -- | -- | |
| Bush Christine | -- | -- | |
| Lamarr Virginia | $4,500 | -- | |
| Lamarr Virginia | $4,500 | -- | |
| -- | $53,600 | -- |
Source: Public Records
Mortgage History
| Date | Status | Borrower | Loan Amount |
|---|---|---|---|
| Open | Lopez Erica E | $85,470 |
Source: Public Records
Tax History Compared to Growth
Tax History
| Year | Tax Paid | Tax Assessment Tax Assessment Total Assessment is a certain percentage of the fair market value that is determined by local assessors to be the total taxable value of land and additions on the property. | Land | Improvement |
|---|---|---|---|---|
| 2024 | $2,408 | $49,400 | $6,420 | $42,980 |
| 2023 | $1,617 | $49,400 | $6,420 | $42,980 |
| 2022 | $1,439 | $40,590 | $5,770 | $34,820 |
| 2021 | $1,419 | $40,590 | $5,770 | $34,820 |
| 2020 | $1,424 | $40,594 | $5,772 | $34,822 |
| 2019 | $1,202 | $32,893 | $4,662 | $28,231 |
| 2018 | $1,206 | $32,893 | $4,662 | $28,231 |
| 2017 | $1,200 | $32,893 | $4,662 | $28,231 |
| 2016 | $1,157 | $31,791 | $4,414 | $27,377 |
| 2015 | $1,141 | $31,791 | $4,414 | $27,377 |
| 2014 | $861 | $31,791 | $4,414 | $27,377 |
| 2013 | $856 | $31,791 | $4,414 | $27,377 |
Source: Public Records
Map
Nearby Homes
- 0 Ohio 67
- 409 S Pine St
- 201 E Pearl St
- 9 E Silver St
- 211 W Benton St
- 307 W Auglaize St
- 307 W Benton St
- 414 W Auglaize St
- 102 Wapak St
- 0 Wapakoneta Cridersville Rd
- 608 W Benton St
- 420 Hoopengarner St
- 322 Cole Dr
- 814 W Benton St
- 808 Aster Dr
- 106 Valleyview Dr
- 109 Bluegrass Dr
- 906 Aster Dr
- 1100 W Auglaize St