
Seller's Agent in 2020
John Heaney
Realty Solutions Inc.
(617) 515-0209
8 in this area
60 Total Sales

Estimated Value: $1,318,433 - $1,593,000
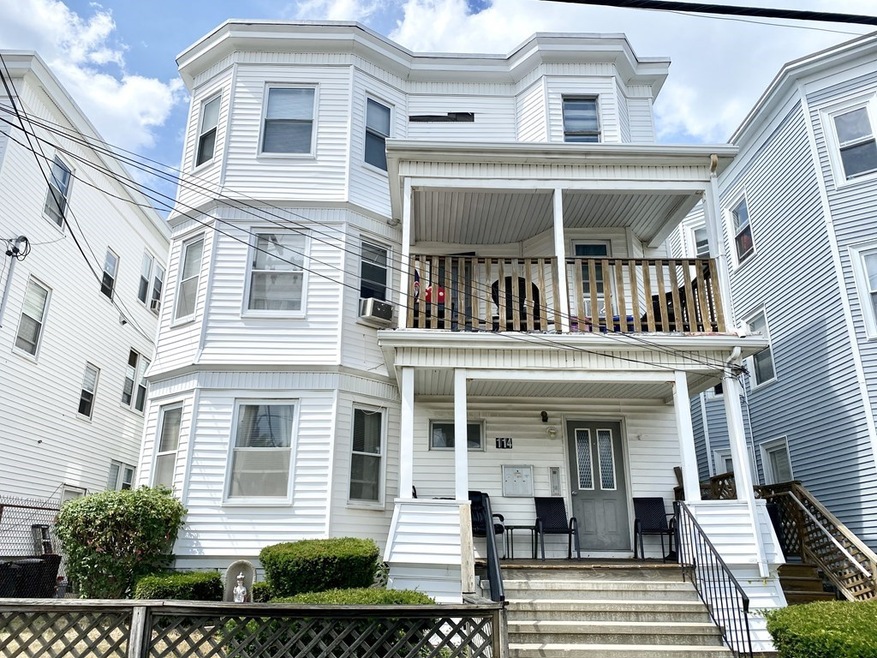
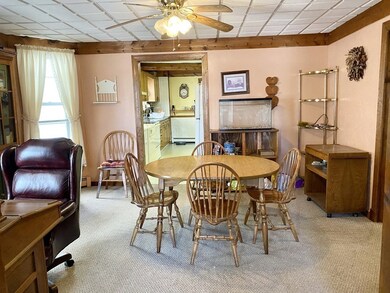
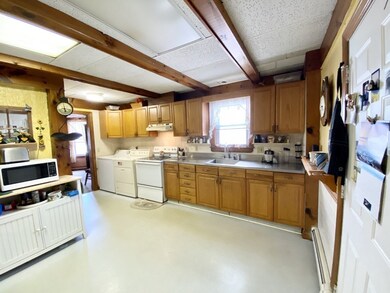
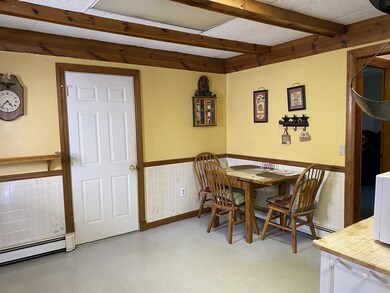
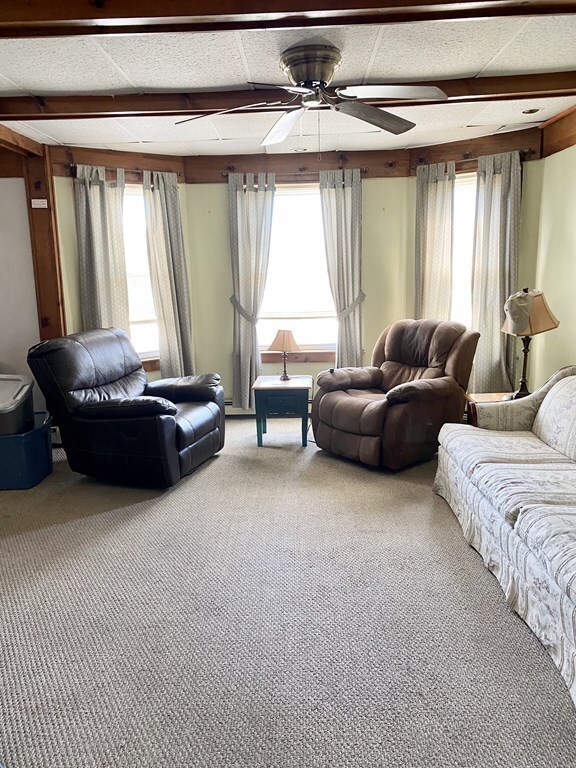
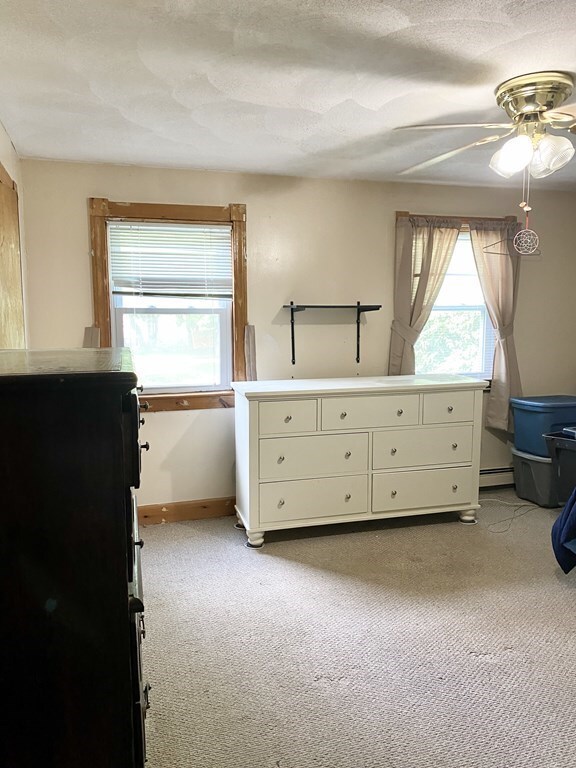
Spectacular location for this oversized 3 family home! Extremely close to the red line, highway, restaurants, Boston, Logan airport, Marina Bay, and so much more! Each unit offers large rooms including, living room, dinning room, eat-in kitchen's with laundry hook ups. Each unit has separate gas heating, hot water system and 2 units have exterior decks. There is a large basement with a finished room and large back yard. This home has been owner occupied for more than 40 plus years, 1 apartment is vacant and the other two are tenant at will. Rents are current below market rates. You do not want to miss this rare find in Quincy! The potential is endless including possible condo conversion. Home is to be sold as is.
| Date | Buyer | Sale Price | Title Company |
|---|---|---|---|
| Lin Yong S | $980,000 | None Available | |
| Dibella Donna | -- | -- |
| Date | Status | Borrower | Loan Amount |
|---|---|---|---|
| Open | Lin Yong S | $735,000 |
| Date | Event | Price | List to Sale | Price per Sq Ft |
|---|---|---|---|---|
| 12/29/2020 12/29/20 | Sold | $980,000 | -6.7% | $218 / Sq Ft |
| 10/01/2020 10/01/20 | Pending | -- | -- | -- |
| 09/23/2020 09/23/20 | For Sale | $1,050,000 | -- | $234 / Sq Ft |
| Year | Tax Paid | Tax Assessment Tax Assessment Total Assessment is a certain percentage of the fair market value that is determined by local assessors to be the total taxable value of land and additions on the property. | Land | Improvement |
|---|---|---|---|---|
| 2025 | $15,321 | $1,328,800 | $383,300 | $945,500 |
| 2024 | $14,297 | $1,268,600 | $383,300 | $885,300 |
| 2023 | $13,025 | $1,170,300 | $348,400 | $821,900 |
| 2022 | $12,505 | $1,043,800 | $278,700 | $765,100 |
| 2021 | $11,890 | $979,400 | $278,700 | $700,700 |
| 2020 | $11,852 | $953,500 | $273,300 | $680,200 |
| 2019 | $10,880 | $866,900 | $262,800 | $604,100 |
| 2018 | $10,868 | $814,700 | $250,200 | $564,500 |
| 2017 | $10,921 | $770,700 | $227,500 | $543,200 |
| 2016 | $9,552 | $665,200 | $206,800 | $458,400 |
| 2015 | $8,881 | $608,300 | $188,000 | $420,300 |
| 2014 | $8,073 | $543,300 | $188,000 | $355,300 |
Seller's Agent in 2020
John Heaney
Realty Solutions Inc.
(617) 515-0209
8 in this area
60 Total Sales
I
Buyer's Agent in 2020
Ivy Li
Dream Realty
(917) 981-8692
4 in this area
58 Total Sales
Source: MLS Property Information Network (MLS PIN)
MLS Number: 72730909
APN: QUIN-006047-000018-000003
Disclaimer: Certain information contained herein is derived from information provided by parties other than Homes.com. All information provided is deemed reliable, but is not guaranteed to be accurate and should be independently verified.
![]() The property listing data and information, or the Images, set forth herein were provided to MLS Property Information Network, Inc. from third party sources, including sellers, lessors and public records, and were compiled by MLS Property Information Network, Inc. The property listing data and information, and the Images, are for the personal, non-commercial use of consumers having a good faith interest in purchasing or leasing listed properties of the type displayed to them and may not be used for any purpose other than to identify prospective properties which such consumers may have a good faith interest in purchasing or leasing. MLS Property Information Network, Inc. and its subscribers disclaim any and all representations and warranties as to the accuracy of the property listing data and information, or as to the accuracy of any of the Images, set forth herein.
The property listing data and information, or the Images, set forth herein were provided to MLS Property Information Network, Inc. from third party sources, including sellers, lessors and public records, and were compiled by MLS Property Information Network, Inc. The property listing data and information, and the Images, are for the personal, non-commercial use of consumers having a good faith interest in purchasing or leasing listed properties of the type displayed to them and may not be used for any purpose other than to identify prospective properties which such consumers may have a good faith interest in purchasing or leasing. MLS Property Information Network, Inc. and its subscribers disclaim any and all representations and warranties as to the accuracy of the property listing data and information, or as to the accuracy of any of the Images, set forth herein.