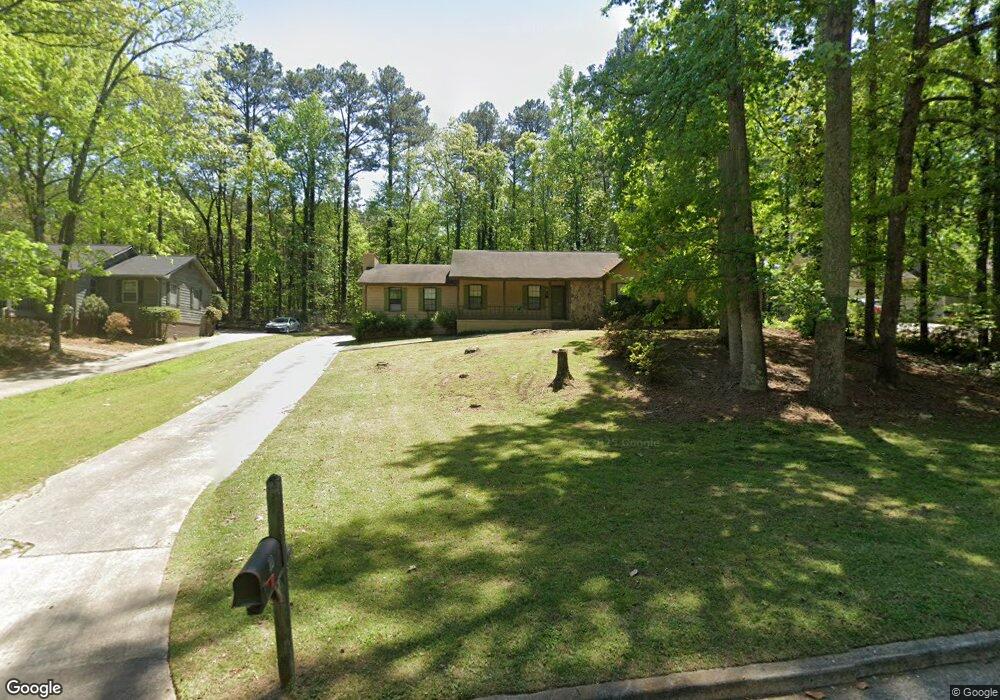
114 Shannon Chase Dr Fairburn, GA 30213
Estimated Value: $236,000 - $261,000
3
Beds
2
Baths
1,973
Sq Ft
$126/Sq Ft
Est. Value
About This Home
This home is located at 114 Shannon Chase Dr, Fairburn, GA 30213 and is currently estimated at $248,643, approximately $126 per square foot. 114 Shannon Chase Dr is a home located in Fulton County with nearby schools including Campbell Elementary School, Renaissance Middle School, and Creekside High School.
Ownership History
Date
Name
Owned For
Owner Type
Purchase Details
Closed on
Jul 29, 2009
Sold by
Deutsche Bk Rali 2006Qs18
Bought by
Arias Maria E
Current Estimated Value
Purchase Details
Closed on
May 5, 2009
Sold by
Dehaven Robert
Bought by
Deutsche Bk Trust C Rali 2006Q
Purchase Details
Closed on
Dec 1, 2006
Sold by
Liberty Two Investments Inc
Bought by
Dehaven Robert
Home Financials for this Owner
Home Financials are based on the most recent Mortgage that was taken out on this home.
Original Mortgage
$105,600
Interest Rate
6.36%
Mortgage Type
New Conventional
Purchase Details
Closed on
May 16, 2006
Sold by
Dehaven Bob
Bought by
Liberty Two Investments Inc
Home Financials for this Owner
Home Financials are based on the most recent Mortgage that was taken out on this home.
Original Mortgage
$99,690
Interest Rate
6.41%
Purchase Details
Closed on
Jan 16, 2001
Sold by
Taylor Judy G
Bought by
Beason Samuel L and Beason Kimberly T
Home Financials for this Owner
Home Financials are based on the most recent Mortgage that was taken out on this home.
Original Mortgage
$102,688
Interest Rate
7.53%
Mortgage Type
FHA
Create a Home Valuation Report for This Property
The Home Valuation Report is an in-depth analysis detailing your home's value as well as a comparison with similar homes in the area
Home Values in the Area
Average Home Value in this Area
Purchase History
| Date | Buyer | Sale Price | Title Company |
|---|---|---|---|
| Arias Maria E | $31,700 | -- | |
| Deutsche Bk Trust C Rali 2006Q | $38,753 | -- | |
| Dehaven Robert | -- | -- | |
| Liberty Two Investments Inc | -- | -- | |
| Dehaven Bob | $85,500 | -- | |
| Beason Samuel L | $103,500 | -- |
Source: Public Records
Mortgage History
| Date | Status | Borrower | Loan Amount |
|---|---|---|---|
| Previous Owner | Dehaven Robert | $105,600 | |
| Previous Owner | Dehaven Bob | $99,690 | |
| Previous Owner | Beason Samuel L | $102,688 |
Source: Public Records
Tax History Compared to Growth
Tax History
| Year | Tax Paid | Tax Assessment Tax Assessment Total Assessment is a certain percentage of the fair market value that is determined by local assessors to be the total taxable value of land and additions on the property. | Land | Improvement |
|---|---|---|---|---|
| 2025 | $510 | $78,320 | $21,000 | $57,320 |
| 2023 | $1,504 | $53,280 | $9,360 | $43,920 |
| 2022 | $1,402 | $53,280 | $9,360 | $43,920 |
| 2021 | $762 | $28,080 | $4,680 | $23,400 |
| 2020 | $772 | $27,760 | $4,640 | $23,120 |
| 2019 | $261 | $27,280 | $4,560 | $22,720 |
| 2018 | $752 | $26,640 | $4,440 | $22,200 |
| 2017 | $582 | $19,960 | $4,280 | $15,680 |
| 2016 | $582 | $19,960 | $4,280 | $15,680 |
| 2015 | $585 | $19,960 | $4,280 | $15,680 |
| 2014 | $612 | $19,960 | $4,280 | $15,680 |
Source: Public Records
Map
Nearby Homes
- 104 Shannon Chase Way Unit 2
- 930 Parkway Rd
- 296 Orme St
- 191 Pine St NE
- 118 Greenwood St
- 111 Poplar St
- 88 Greenwood St
- 0 Willow Creek Rd Unit LOTS 1,2,3,5,6
- 0 Willow Creek Rd
- 179 Stanchion Dr
- 187 Stanchion Dr
- 185 Stanchion Dr
- 203 Switcher Ct
- 323 Crimson Dr Unit 124
- 323 Crimson Dr
- 422 Camrose Ave
- 424 Camrose Ave
- 423 Camrose Ave
- 183 Stanchion Dr
- 116 Shannon Chase Dr Unit 1
- 112 Shannon Chase Dr
- 118 Shannon Chase Dr
- 110 Shannon Chase Dr
- 115 Shannon Chase Dr
- 113 Shannon Chase Dr
- 111 Shannon Chase Dr Unit 1
- 120 Shannon Chase Dr Unit 1
- 117 Shannon Chase Dr
- 108 Shannon Chase Dr
- 109 Shannon Chase Dr
- 416 Fayetteville Rd
- 101 Shannon Chase Way
- 103 Shannon Chase Way Unit 2
- 106 Shannon Chase Dr Unit 1
- 100 Shannon Chase Way Unit 2
- 122 Shannon Chase Dr
- 107 Shannon Chase Dr Unit 1
- 119 Shannon Chase Dr Unit 1
- 406 Fayetteville Rd