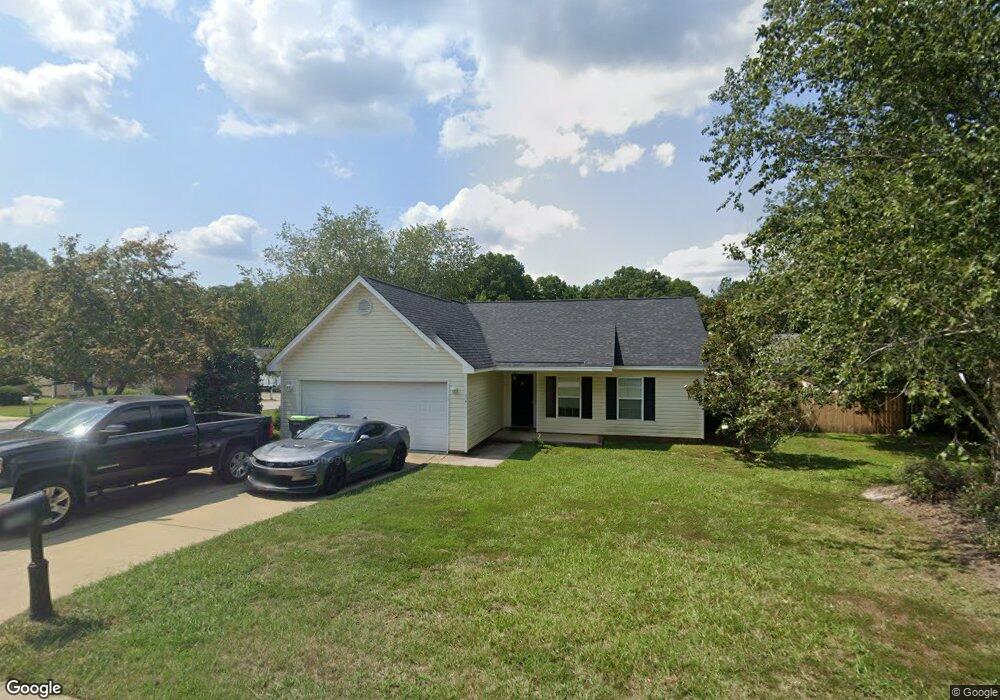
114 Shipyard Blvd Chapin, SC 29036
Estimated Value: $225,000 - $277,000
3
Beds
2
Baths
1,393
Sq Ft
$179/Sq Ft
Est. Value
About This Home
This home is located at 114 Shipyard Blvd, Chapin, SC 29036 and is currently estimated at $249,016, approximately $178 per square foot. 114 Shipyard Blvd is a home located in Lexington County with nearby schools including Chapin Elementary School, Chapin Intermediate, and Chapin High School.
Ownership History
Date
Name
Owned For
Owner Type
Purchase Details
Closed on
Feb 23, 2024
Sold by
Opendoor Property Trust
Bought by
Simons Alfred Eugene and Simons Patricia Diane
Current Estimated Value
Purchase Details
Closed on
Nov 29, 2023
Sold by
Moye Richard Allen
Bought by
Opendoor Property Trust
Purchase Details
Closed on
Sep 24, 2009
Sold by
Moye Elizabeth R
Bought by
Moye Richard Allen
Purchase Details
Closed on
Jan 16, 2004
Sold by
Lake Murray Prop Inc
Bought by
Hurricane Constr Inc
Purchase Details
Closed on
Dec 17, 2003
Sold by
Wyman Boozer Realty Inc
Bought by
Lake Murray Prop Inc
Purchase Details
Closed on
Aug 5, 1999
Sold by
Boozer Ronald F
Bought by
Wyman Boozer Realty Inc
Create a Home Valuation Report for This Property
The Home Valuation Report is an in-depth analysis detailing your home's value as well as a comparison with similar homes in the area
Home Values in the Area
Average Home Value in this Area
Purchase History
| Date | Buyer | Sale Price | Title Company |
|---|---|---|---|
| Simons Alfred Eugene | $247,000 | None Listed On Document | |
| Opendoor Property Trust | $223,900 | None Listed On Document | |
| Moye Richard Allen | -- | -- | |
| Hurricane Constr Inc | $48,000 | -- | |
| Lake Murray Prop Inc | $52,000 | -- | |
| Wyman Boozer Realty Inc | $27,000 | -- |
Source: Public Records
Tax History
| Year | Tax Paid | Tax Assessment Tax Assessment Total Assessment is a certain percentage of the fair market value that is determined by local assessors to be the total taxable value of land and additions on the property. | Land | Improvement |
|---|---|---|---|---|
| 2024 | $1,415 | $9,756 | $1,000 | $8,756 |
| 2023 | $1,493 | $5,459 | $1,000 | $4,459 |
| 2022 | $843 | $5,459 | $1,000 | $4,459 |
| 2020 | $883 | $5,459 | $1,000 | $4,459 |
| 2019 | $799 | $4,856 | $1,000 | $3,856 |
| 2018 | $704 | $4,856 | $1,000 | $3,856 |
| 2017 | $686 | $4,856 | $1,000 | $3,856 |
| 2016 | $703 | $4,855 | $1,000 | $3,855 |
| 2014 | $723 | $5,019 | $1,000 | $4,019 |
| 2013 | -- | $5,020 | $1,000 | $4,020 |
Source: Public Records
Map
Nearby Homes
- 106 Shipyard Blvd
- 212 Walkbridge Way
- 0 Dreher Island Rd Unit 21647709
- 0 Dreher Island Rd Unit 587193
- 141 Palm St
- 180 Palm St
- 192 Palm St
- 155 Sylvan St
- 147 Ventnor Ave
- 151 Ventnor Ave
- 188 Kerry Gibbons Dr
- 108 Pennsylvania Ct
- 125 Northshore Dr
- 190 Elm Creek Dr
- 409 Dutchman Shores Cir
- 524 Murray Lindler Rd
- 1168 Old Bush River Rd
- 171 Elm Creek Dr
- 540 Lakeshore Dr
- 118 Pacific Ave
- 110 Shipyard Blvd
- 218 Shipyard Ct
- 228 Shipyard Ct
- 205 Shipyard Ct
- 201 Shipyard Ct
- 232 Shipyard Ct
- 209 Shipyard Ct
- 113 Shipyard Blvd
- 117 Shipyard Blvd
- 236 Shipyard Ct
- 121 Shipyard Blvd
- 109 Shipyard Blvd
- 104 Shipyard Blvd
- 213 Shipyard Ct
- 128 Shipyard Blvd
- 125 Shipyard Blvd
- 240 Shipyard Ct
- 102 Shipyard Blvd
- 107 Shipyard Blvd
- 225 Shipyard Ct
Your Personal Tour Guide
Ask me questions while you tour the home.