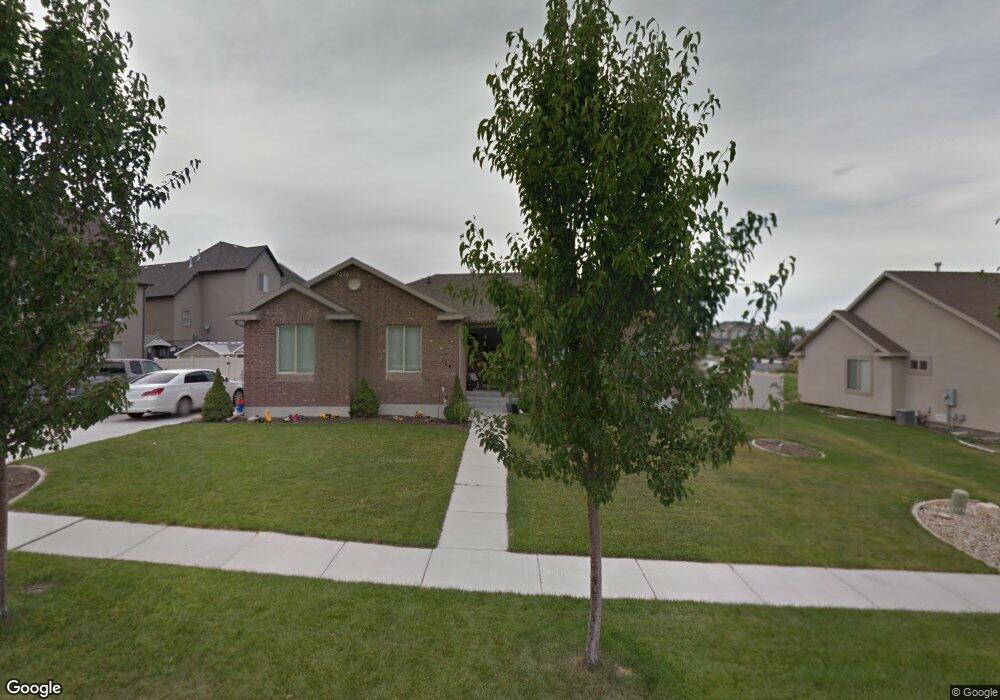
114 Silver Fox Ln Saratoga Springs, UT 84045
Estimated Value: $585,000 - $662,000
3
Beds
4
Baths
1,533
Sq Ft
$400/Sq Ft
Est. Value
About This Home
This home is located at 114 Silver Fox Ln, Saratoga Springs, UT 84045 and is currently estimated at $612,491, approximately $399 per square foot. 114 Silver Fox Ln is a home located in Utah County with nearby schools including Sage Hills Elementary School, Lake Mountain Middle School, and Westlake High School.
Ownership History
Date
Name
Owned For
Owner Type
Purchase Details
Closed on
Dec 31, 2024
Sold by
Ellis Cassidy and Ellis Torrie
Bought by
Ellis Family Trust and Ellis
Current Estimated Value
Purchase Details
Closed on
Jun 17, 2021
Sold by
Bria Cameron Scot and Bria Jaime L
Bought by
Ellis Cassidy and Ellis Torrie
Home Financials for this Owner
Home Financials are based on the most recent Mortgage that was taken out on this home.
Original Mortgage
$499,900
Interest Rate
2.9%
Mortgage Type
New Conventional
Purchase Details
Closed on
Apr 1, 2008
Sold by
Walker Tyson R
Bought by
Bria Cameron Scot and Bria Jaime L
Home Financials for this Owner
Home Financials are based on the most recent Mortgage that was taken out on this home.
Original Mortgage
$251,060
Interest Rate
6.22%
Mortgage Type
FHA
Create a Home Valuation Report for This Property
The Home Valuation Report is an in-depth analysis detailing your home's value as well as a comparison with similar homes in the area
Home Values in the Area
Average Home Value in this Area
Purchase History
| Date | Buyer | Sale Price | Title Company |
|---|---|---|---|
| Ellis Family Trust | -- | None Listed On Document | |
| Ellis Cassidy | -- | Eagle Gate Ttl Ins Agcy Inc | |
| Bria Cameron Scot | -- | Bonneville Superior Af |
Source: Public Records
Mortgage History
| Date | Status | Borrower | Loan Amount |
|---|---|---|---|
| Previous Owner | Ellis Cassidy | $499,900 | |
| Previous Owner | Bria Cameron Scot | $251,060 |
Source: Public Records
Tax History Compared to Growth
Tax History
| Year | Tax Paid | Tax Assessment Tax Assessment Total Assessment is a certain percentage of the fair market value that is determined by local assessors to be the total taxable value of land and additions on the property. | Land | Improvement |
|---|---|---|---|---|
| 2025 | $2,256 | $538,100 | $194,800 | $343,300 |
| 2024 | $2,256 | $270,985 | $0 | $0 |
| 2023 | $2,132 | $275,330 | $0 | $0 |
| 2022 | $2,326 | $292,985 | $0 | $0 |
| 2021 | $1,969 | $370,300 | $131,800 | $238,500 |
| 2020 | $1,879 | $347,000 | $117,700 | $229,300 |
| 2019 | $1,694 | $323,900 | $110,400 | $213,500 |
| 2018 | $1,674 | $302,100 | $110,400 | $191,700 |
| 2017 | $1,681 | $162,305 | $0 | $0 |
| 2016 | $1,539 | $137,885 | $0 | $0 |
| 2015 | $1,497 | $127,270 | $0 | $0 |
| 2014 | $1,444 | $121,330 | $0 | $0 |
Source: Public Records
Map
Nearby Homes
- 2868 S Cottontail Loop
- 2819 S Silver Fox Ln
- 66 W Wildflower Dr
- 161 W Sweetbriar Ln
- 2913 S Yellow Bill Dr Unit 105
- 323 W Willow Creek Dr
- 2956 S Willow Creek Dr
- 3023 S Red Pine Dr Unit 2526
- 2849 S Drake Ave
- 388 W Peppergrass Way
- 2987 S Willow Creek Dr
- 2862 S Preening Way
- 3123 S Hollow Way
- 2873 S Puddle Ln
- 2887 S Puddle Ln
- 3181 S Hickory St
- 2913 S Puddle Ln
- 2867 S Greenhead Dr
- 2954 S Fox Pointe Dr
- 2948 S Puddle Ln
- 114 W Silver Fox Ln
- 2843 Silver Fox Cir
- 2846 S Village Court Rd
- 2846 Village Court Rd
- 2829 S Silver Fox Cir
- 2829 Silver Fox Cir
- 2836 S Village Court Rd
- 128 Silver Fox Ln
- 2824 Village Court Rd
- 2836 Village Court Rd
- 2832 Silver Fox Cir
- 117 Silver Fox Ln
- 117 Silver Fox Ln Unit 103
- 107 Silver Fox Ln
- 107 W Silver Fox Ln
- 117 W Silver Fox Ln
- 123 Silver Fox Ln
- 123 W Silver Fox Ln Unit 102
- 2866 Village Court Rd
- 93 Silver Fox Ln