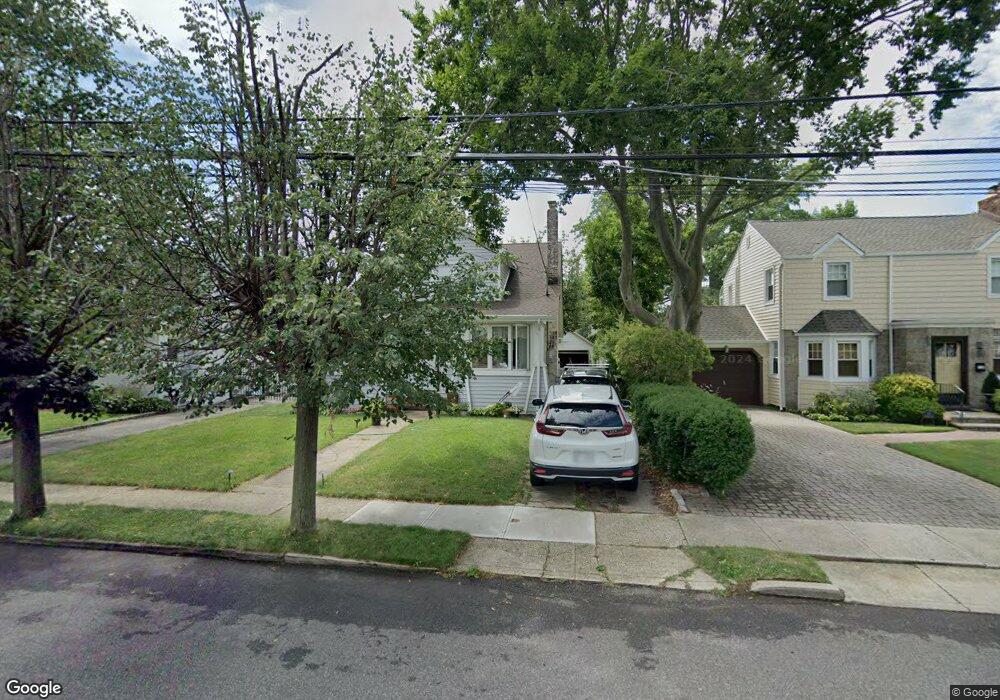
114 Utterby Rd Malverne, NY 11565
Estimated Value: $679,592 - $840,000
5
Beds
2
Baths
1,482
Sq Ft
$513/Sq Ft
Est. Value
About This Home
This home is located at 114 Utterby Rd, Malverne, NY 11565 and is currently estimated at $759,796, approximately $512 per square foot. 114 Utterby Rd is a home located in Nassau County with nearby schools including Maurice W. Downing Primary K-2 School, Davison Avenue Intermediate School, and Howard T Herber Middle School.
Ownership History
Date
Name
Owned For
Owner Type
Purchase Details
Closed on
Aug 30, 2017
Sold by
Gillen Peter
Bought by
Sun Xuming
Current Estimated Value
Home Financials for this Owner
Home Financials are based on the most recent Mortgage that was taken out on this home.
Original Mortgage
$392,000
Outstanding Balance
$327,611
Interest Rate
3.93%
Mortgage Type
New Conventional
Estimated Equity
$432,185
Purchase Details
Closed on
Jan 27, 2004
Sold by
Gillen Peter
Create a Home Valuation Report for This Property
The Home Valuation Report is an in-depth analysis detailing your home's value as well as a comparison with similar homes in the area
Home Values in the Area
Average Home Value in this Area
Purchase History
| Date | Buyer | Sale Price | Title Company |
|---|---|---|---|
| Sun Xuming | $490,000 | Abstracts Incorporated | |
| -- | -- | -- |
Source: Public Records
Mortgage History
| Date | Status | Borrower | Loan Amount |
|---|---|---|---|
| Open | Sun Xuming | $392,000 |
Source: Public Records
Tax History
| Year | Tax Paid | Tax Assessment Tax Assessment Total Assessment is a certain percentage of the fair market value that is determined by local assessors to be the total taxable value of land and additions on the property. | Land | Improvement |
|---|---|---|---|---|
| 2025 | $9,408 | $440 | $179 | $261 |
| 2024 | $959 | $449 | $183 | $266 |
Source: Public Records
Map
Nearby Homes
- 31 Alden Ct
- 89 Linmouth Rd
- 25 Sterling Place
- 35 Park Blvd
- 601 Chautauqua Ave
- 28 Saint Thomas Place
- 18 School St
- 44 School St
- 945 Derrick Adkins Ln
- 205 Hempstead Ave
- 72 Cedar Rd
- 17 Oxford St
- 1090 Pinebrook Ct
- 529 Clinton Ave
- 7 Hopatcong Ave
- 1095 Pinebrook Ct
- 486 Champlain Ave
- 480 Hopatcong Ave
- 362 Langdon Blvd
- 1024 Mahopac Rd
Your Personal Tour Guide
Ask me questions while you tour the home.