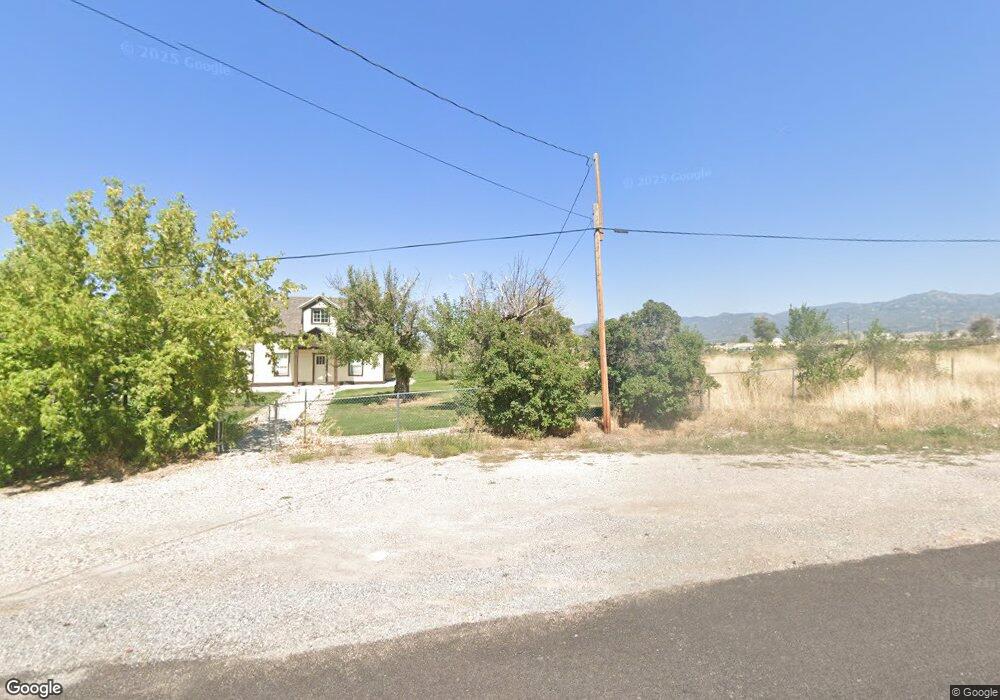
114 W 500 N Mount Pleasant, UT 84647
Estimated Value: $274,000 - $395,000
3
Beds
2
Baths
1,827
Sq Ft
$186/Sq Ft
Est. Value
About This Home
This home is located at 114 W 500 N, Mount Pleasant, UT 84647 and is currently estimated at $340,410, approximately $186 per square foot. 114 W 500 N is a home located in Sanpete County with nearby schools including North Sanpete High School and Wasatch Academy.
Ownership History
Date
Name
Owned For
Owner Type
Purchase Details
Closed on
Apr 20, 2018
Sold by
Bennett James A
Bought by
Coates Colton
Current Estimated Value
Home Financials for this Owner
Home Financials are based on the most recent Mortgage that was taken out on this home.
Original Mortgage
$162,011
Outstanding Balance
$139,391
Interest Rate
4.46%
Mortgage Type
New Conventional
Estimated Equity
$201,019
Purchase Details
Closed on
Jul 27, 2011
Sold by
Novastar Mortgage Inc
Bought by
Britannia Llc
Purchase Details
Closed on
Sep 27, 2006
Sold by
Parks Sharon E
Bought by
Neilson Rusty D
Create a Home Valuation Report for This Property
The Home Valuation Report is an in-depth analysis detailing your home's value as well as a comparison with similar homes in the area
Home Values in the Area
Average Home Value in this Area
Purchase History
| Date | Buyer | Sale Price | Title Company |
|---|---|---|---|
| Coates Colton | $202,513 | Juab Title & Abs Co | |
| Britannia Llc | -- | -- | |
| Neilson Rusty D | -- | -- |
Source: Public Records
Mortgage History
| Date | Status | Borrower | Loan Amount |
|---|---|---|---|
| Open | Coates Colton | $162,011 |
Source: Public Records
Tax History Compared to Growth
Tax History
| Year | Tax Paid | Tax Assessment Tax Assessment Total Assessment is a certain percentage of the fair market value that is determined by local assessors to be the total taxable value of land and additions on the property. | Land | Improvement |
|---|---|---|---|---|
| 2024 | $1,147 | $144,469 | $0 | $0 |
| 2023 | $1,112 | $135,651 | $0 | $0 |
| 2022 | $1,113 | $121,118 | $0 | $0 |
| 2021 | $995 | $99,000 | $0 | $0 |
| 2020 | $588 | $54,245 | $0 | $0 |
| 2019 | $579 | $50,662 | $0 | $0 |
| 2018 | $522 | $80,098 | $27,412 | $52,686 |
| 2017 | $501 | $44,054 | $0 | $0 |
| 2016 | $469 | $41,303 | $0 | $0 |
| 2015 | $465 | $40,314 | $0 | $0 |
| 2014 | $464 | $40,314 | $0 | $0 |
| 2013 | $450 | $40,314 | $0 | $0 |
Source: Public Records
Map
Nearby Homes