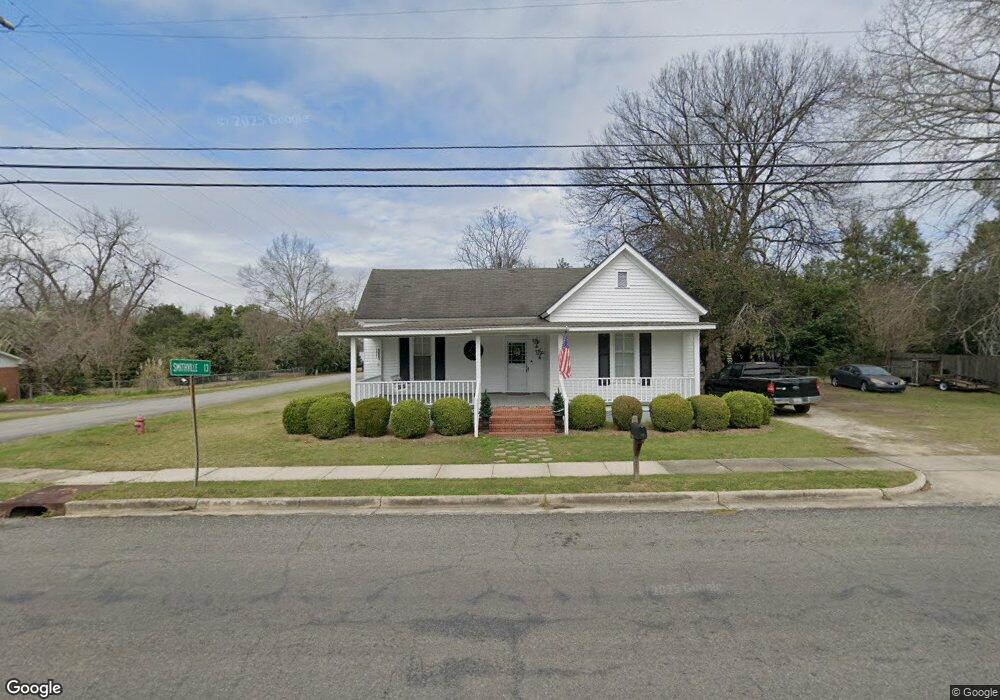
114 W Allen St Leslie, GA 31764
Estimated Value: $62,002 - $184,000
3
Beds
1
Bath
1,088
Sq Ft
$111/Sq Ft
Est. Value
About This Home
This home is located at 114 W Allen St, Leslie, GA 31764 and is currently estimated at $120,751, approximately $110 per square foot. 114 W Allen St is a home located in Sumter County with nearby schools including Sumter County Primary School, Sumter County Elementary School, and Sumter County Middle School.
Ownership History
Date
Name
Owned For
Owner Type
Purchase Details
Closed on
Sep 16, 2015
Sold by
Smith Tommy C
Bought by
Jimenez Eduardo and Jimenez Nely E
Current Estimated Value
Home Financials for this Owner
Home Financials are based on the most recent Mortgage that was taken out on this home.
Original Mortgage
$24,310
Interest Rate
3.97%
Mortgage Type
New Conventional
Purchase Details
Closed on
Nov 22, 2011
Sold by
Lott John R
Bought by
Smith Tommy C
Purchase Details
Closed on
Apr 26, 2004
Sold by
Lott John R and Lott Ginge
Bought by
Lott John R
Purchase Details
Closed on
Jul 12, 1993
Bought by
Lott John R and Lott Ginge
Purchase Details
Closed on
Nov 15, 1982
Bought by
Bass Fred and Bass Fran
Purchase Details
Closed on
Sep 27, 1982
Bought by
Summerford Mrs Rosa
Purchase Details
Closed on
Jun 30, 1982
Bought by
Wade Walter and Wade Jean
Create a Home Valuation Report for This Property
The Home Valuation Report is an in-depth analysis detailing your home's value as well as a comparison with similar homes in the area
Home Values in the Area
Average Home Value in this Area
Purchase History
| Date | Buyer | Sale Price | Title Company |
|---|---|---|---|
| Jimenez Eduardo | $28,600 | -- | |
| Smith Tommy C | $48,000 | -- | |
| Lott John R | -- | -- | |
| Lott John R | $35,000 | -- | |
| Bass Fred | $6,000 | -- | |
| Summerford Mrs Rosa | -- | -- | |
| Wade Walter | -- | -- |
Source: Public Records
Mortgage History
| Date | Status | Borrower | Loan Amount |
|---|---|---|---|
| Closed | Jimenez Eduardo | $24,310 |
Source: Public Records
Tax History Compared to Growth
Tax History
| Year | Tax Paid | Tax Assessment Tax Assessment Total Assessment is a certain percentage of the fair market value that is determined by local assessors to be the total taxable value of land and additions on the property. | Land | Improvement |
|---|---|---|---|---|
| 2024 | $683 | $16,000 | $1,240 | $14,760 |
| 2023 | $668 | $16,000 | $1,240 | $14,760 |
| 2022 | $484 | $16,000 | $1,240 | $14,760 |
| 2021 | $485 | $16,000 | $1,240 | $14,760 |
| 2020 | $502 | $16,000 | $1,240 | $14,760 |
| 2019 | $503 | $16,000 | $1,240 | $14,760 |
| 2018 | $503 | $16,000 | $1,240 | $14,760 |
| 2017 | $503 | $16,000 | $1,240 | $14,760 |
| 2016 | $504 | $16,000 | $1,240 | $14,760 |
| 2015 | $513 | $16,640 | $1,240 | $15,400 |
| 2014 | $513 | $16,640 | $1,240 | $15,400 |
| 2013 | -- | $16,640 | $1,240 | $15,400 |
Source: Public Records
Map
Nearby Homes
- 0 N A Unit 10613160
- 708 Georgia 118
- 139 E Allen St
- 177 S Bailey Ave
- 1875 Hooks Mill Rd
- 1826 Hooks Mill Rd
- Hwy Georgia 195
- 110 Tom Holman Rd
- N/A Mclean Dr SE
- 107 Oakridge Dr
- 101 Rose Ln
- 114 Water Front Rd
- 115 Cypress Ln
- 108 N Spring Creek Cir
- 119 A-B Tommy Warren Dr
- TBD N Spring Creek Cir
- 0 N Spring Creek Cir
- 376 N Spring Creek Cir
- 121 E Entrekin Rd
- 109 Allen Chapel Rd
- 115 W Allen St
- 110 W Allen St
- 120 W Allen St
- 121 W Allen St
- 109 W Allen St
- 115 W Wilson St
- 111 N Kemp St
- 125 W Allen St
- 108 S Kemp St
- 105 N Bailey Ave
- 115 N Kemp St
- 101 N Bailey Ave
- 106 S Bailey Ave
- 107 N Bailey Ave
- 129 W Allen St
- 109 N Bailey Ave
- 112 Howell St
- 120 W Wilson St
- 101 S Bailey Ave
- 104 W Wilson St