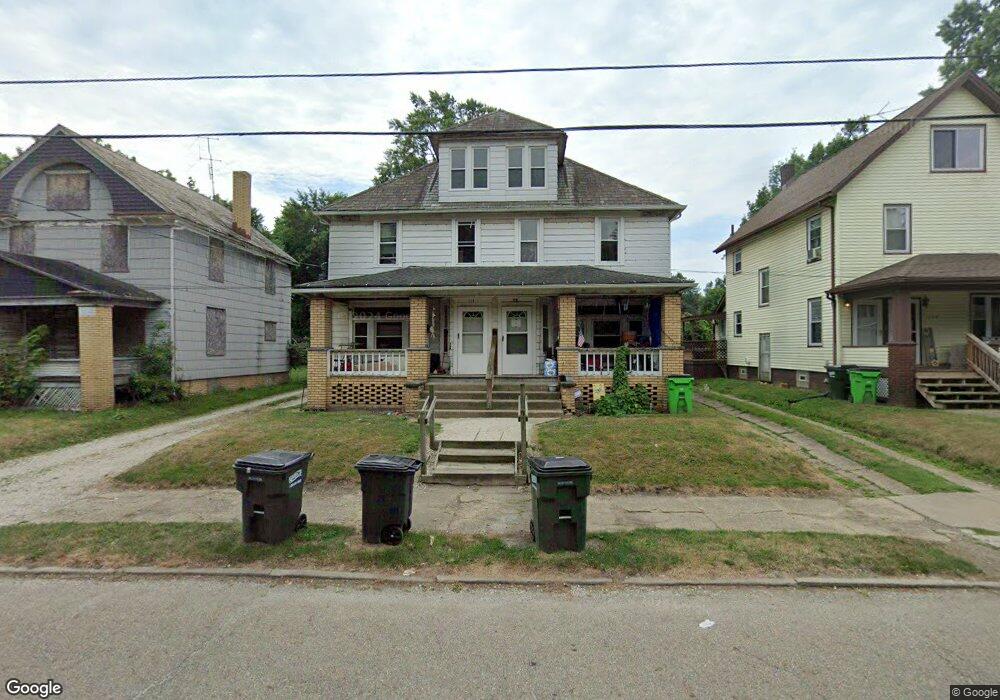
114 W Harrison St Alliance, OH 44601
Estimated Value: $73,651 - $127,000
6
Beds
2
Baths
3,240
Sq Ft
$31/Sq Ft
Est. Value
About This Home
This home is located at 114 W Harrison St, Alliance, OH 44601 and is currently estimated at $100,163, approximately $30 per square foot. 114 W Harrison St is a home located in Stark County with nearby schools including Alliance Early Learning School, Alliance Intermediate School at Northside, and Alliance Middle School.
Ownership History
Date
Name
Owned For
Owner Type
Purchase Details
Closed on
Dec 30, 2005
Sold by
Zak Jason
Bought by
Stickler Paul
Current Estimated Value
Home Financials for this Owner
Home Financials are based on the most recent Mortgage that was taken out on this home.
Original Mortgage
$36,000
Outstanding Balance
$20,390
Interest Rate
6.4%
Mortgage Type
Fannie Mae Freddie Mac
Estimated Equity
$79,773
Purchase Details
Closed on
Jul 7, 2005
Sold by
Antram Leonard A
Bought by
Zak Jason and 114 Harrison St W Residential Land Trust
Purchase Details
Closed on
May 1, 2003
Sold by
Antram Enterprises Ltd
Bought by
Antram Leonard
Purchase Details
Closed on
Nov 30, 2000
Sold by
Antram Leonard
Bought by
Antram Enterprises Ltd
Purchase Details
Closed on
May 10, 2000
Sold by
Ray James A and Ray Jennifer
Bought by
Antram Leonard
Home Financials for this Owner
Home Financials are based on the most recent Mortgage that was taken out on this home.
Original Mortgage
$48,600
Interest Rate
10%
Mortgage Type
Purchase Money Mortgage
Purchase Details
Closed on
Dec 16, 1997
Sold by
Israel Donald E
Bought by
Ray James A and Ray Jennifer
Create a Home Valuation Report for This Property
The Home Valuation Report is an in-depth analysis detailing your home's value as well as a comparison with similar homes in the area
Home Values in the Area
Average Home Value in this Area
Purchase History
| Date | Buyer | Sale Price | Title Company |
|---|---|---|---|
| Stickler Paul | $40,000 | Cresent Title Agency Llc | |
| Zak Jason | -- | -- | |
| Antram Leonard | -- | -- | |
| Antram Enterprises Ltd | -- | -- | |
| Antram Leonard | $54,000 | -- | |
| Ray James A | $20,192 | -- |
Source: Public Records
Mortgage History
| Date | Status | Borrower | Loan Amount |
|---|---|---|---|
| Open | Stickler Paul | $36,000 | |
| Previous Owner | Antram Leonard | $48,600 |
Source: Public Records
Tax History Compared to Growth
Tax History
| Year | Tax Paid | Tax Assessment Tax Assessment Total Assessment is a certain percentage of the fair market value that is determined by local assessors to be the total taxable value of land and additions on the property. | Land | Improvement |
|---|---|---|---|---|
| 2025 | -- | $15,060 | $6,270 | $8,790 |
| 2024 | -- | $15,060 | $6,270 | $8,790 |
| 2023 | $782 | $19,010 | $6,200 | $12,810 |
| 2022 | $788 | $19,010 | $6,200 | $12,810 |
| 2021 | $790 | $19,010 | $6,200 | $12,810 |
| 2020 | $718 | $16,140 | $5,390 | $10,750 |
| 2019 | $708 | $16,140 | $5,390 | $10,750 |
| 2018 | $712 | $16,140 | $5,390 | $10,750 |
| 2017 | $560 | $12,470 | $3,640 | $8,830 |
| 2016 | $564 | $12,470 | $3,640 | $8,830 |
| 2015 | $355 | $12,260 | $3,610 | $8,650 |
| 2014 | $628 | $13,090 | $3,850 | $9,240 |
| 2013 | $313 | $13,090 | $3,850 | $9,240 |
Source: Public Records
Map
Nearby Homes
- 710 N Freedom Ave
- 124 E Wayne St
- 163 W Market St
- 329 1/2 W Main St
- 511 W Ely St
- 132 S Haines Ave
- 345 W Market St
- 361 E Main St
- 427 S Union Ave
- 356 E Broadway St
- 142 S Seneca Ave
- 432 S Linden Ave
- V/L S Fredeom Ave
- 652 N Webb Ave
- 140 W Summit St
- 432 Johnson Ave
- 000 Meadowbrook Ave
- 11344 Walnut Ave NE
- 263 Franklin Ave
- 807 S Union Ave
- 102 W Harrison St
- 130 W Harrison St
- 82 W Harrison St
- 138 W Harrison St
- 146 W Harrison St
- 74 W Harrison St
- 109 W Ely St
- 147 W Ely St
- 105 W Ely St
- 115 W Ely St
- 121 W Harrison St
- 105 W Harrison St
- 105 W Harrison St
- 81 W Harrison St
- 151 W Ely St
- 81 W Harrison St
- 133 W Harrison St
- 133 W Harrison St
- 60 W Harrison St
- 166 W Harrison St