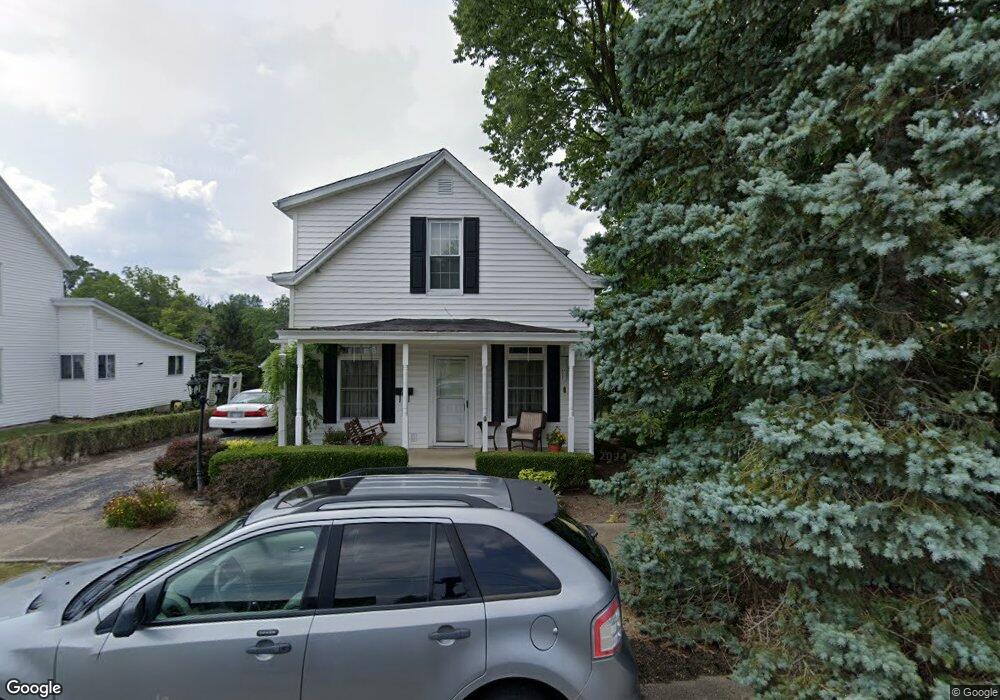
114 W Johns St Blanchester, OH 45107
Estimated Value: $157,992 - $252,000
2
Beds
2
Baths
1,411
Sq Ft
$146/Sq Ft
Est. Value
About This Home
This home is located at 114 W Johns St, Blanchester, OH 45107 and is currently estimated at $205,498, approximately $145 per square foot. 114 W Johns St is a home located in Clinton County with nearby schools including Putman Elementary School, Blanchester Middle School, and Blanchester High School.
Ownership History
Date
Name
Owned For
Owner Type
Purchase Details
Closed on
Sep 9, 2010
Sold by
Brooks Charles L
Bought by
Brooks Nancy J
Current Estimated Value
Purchase Details
Closed on
Oct 5, 2005
Sold by
Malott Nancy J and Brooks Nancy J
Bought by
Brooks Charles L and Brooks Nancy J
Home Financials for this Owner
Home Financials are based on the most recent Mortgage that was taken out on this home.
Original Mortgage
$33,000
Interest Rate
5.88%
Mortgage Type
Credit Line Revolving
Purchase Details
Closed on
Aug 1, 2000
Sold by
Thompson William M
Bought by
Burns Nancy
Home Financials for this Owner
Home Financials are based on the most recent Mortgage that was taken out on this home.
Original Mortgage
$59,400
Interest Rate
8.27%
Mortgage Type
New Conventional
Purchase Details
Closed on
Aug 31, 1992
Bought by
Thompson William M
Create a Home Valuation Report for This Property
The Home Valuation Report is an in-depth analysis detailing your home's value as well as a comparison with similar homes in the area
Home Values in the Area
Average Home Value in this Area
Purchase History
| Date | Buyer | Sale Price | Title Company |
|---|---|---|---|
| Brooks Nancy J | -- | -- | |
| Brooks Charles L | -- | None Available | |
| Burns Nancy | $66,000 | -- | |
| Thompson William M | -- | -- |
Source: Public Records
Mortgage History
| Date | Status | Borrower | Loan Amount |
|---|---|---|---|
| Previous Owner | Brooks Charles L | $33,000 | |
| Previous Owner | Burns Nancy | $59,400 |
Source: Public Records
Tax History
| Year | Tax Paid | Tax Assessment Tax Assessment Total Assessment is a certain percentage of the fair market value that is determined by local assessors to be the total taxable value of land and additions on the property. | Land | Improvement |
|---|---|---|---|---|
| 2024 | $1,455 | $41,270 | $4,760 | $36,510 |
| 2023 | $1,544 | $41,270 | $4,760 | $36,510 |
| 2022 | $1,292 | $31,270 | $4,120 | $27,150 |
| 2021 | $1,354 | $31,270 | $4,120 | $27,150 |
| 2020 | $1,350 | $31,270 | $4,120 | $27,150 |
| 2019 | $1,001 | $22,470 | $4,130 | $18,340 |
| 2018 | $1,005 | $22,470 | $4,130 | $18,340 |
| 2017 | $492 | $22,470 | $4,130 | $18,340 |
| 2016 | $780 | $18,660 | $4,170 | $14,490 |
| 2015 | $780 | $18,660 | $4,170 | $14,490 |
| 2013 | $871 | $20,240 | $4,170 | $16,070 |
Source: Public Records
Map
Nearby Homes
- 112 W Baldwin St
- 203 E Main St
- 1 Middleboro Rd
- 502 Railroad St
- 305 E Main St
- 117 Pansy Pike
- 308 Lazenby St
- 157 Pansy Pike
- 308 S Broadway St
- 501 E Johns St
- 143 W Fancy St
- 503 S Broadway St
- 507 Bourbon St
- 9 Pansy Pike
- 11 Pansy Pike
- 12 Pansy Pike
- 10 Pansy Pike
- 501 S Wright St
- 0 Ohio 123 Unit 11 938995
- 0 Ohio 123 Unit 1848086
- 120 W Johns St
- 110 W Johns St
- 110 W Johns St
- 117 W Johns St
- 106 W Johns St
- 111 W Johns St
- 201 W Johns St
- 403 N Broadway St
- 401 N Broadway St
- 200 W Johns St
- 317 N Broadway St
- 313 N Broadway St
- 407 N Broadway St
- 200 W Johns St
- 309 N Broadway St
- 213 W Johns St
- 212 W John St
- 0 John St Unit 1133820
- 114 W Baldwin St
- 110 W Baldwin St
Your Personal Tour Guide
Ask me questions while you tour the home.