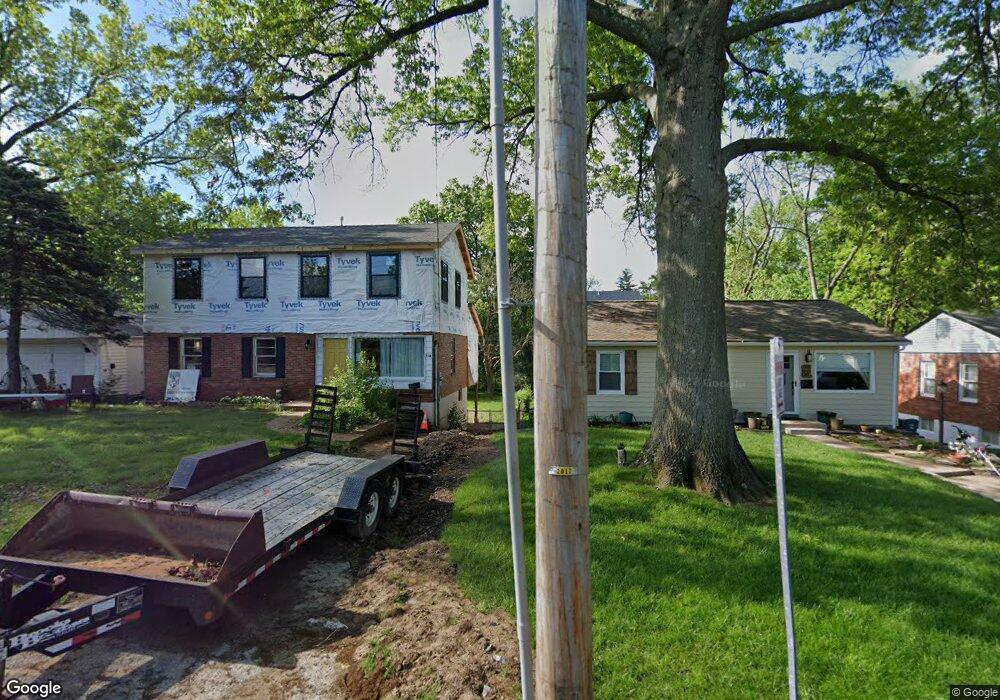
114 W Sarah Ave Saint Louis, MO 63122
Estimated Value: $403,000 - $601,000
3
Beds
1
Bath
1,350
Sq Ft
$387/Sq Ft
Est. Value
About This Home
This home is located at 114 W Sarah Ave, Saint Louis, MO 63122 and is currently estimated at $521,909, approximately $386 per square foot. 114 W Sarah Ave is a home located in St. Louis County with nearby schools including F.P. Tillman Elementary School, North Kirkwood Middle School, and Kirkwood Senior High School.
Ownership History
Date
Name
Owned For
Owner Type
Purchase Details
Closed on
Dec 18, 2019
Sold by
Bergen Rena C and Bergen George E
Bought by
Bergen George E and Bergen Rena C
Current Estimated Value
Home Financials for this Owner
Home Financials are based on the most recent Mortgage that was taken out on this home.
Original Mortgage
$176,000
Outstanding Balance
$119,453
Interest Rate
3.6%
Mortgage Type
New Conventional
Estimated Equity
$402,456
Purchase Details
Closed on
Aug 30, 2013
Sold by
Access Properties Inc
Bought by
Godley Rena
Home Financials for this Owner
Home Financials are based on the most recent Mortgage that was taken out on this home.
Original Mortgage
$145,400
Interest Rate
4.5%
Mortgage Type
FHA
Purchase Details
Closed on
Jan 10, 2001
Sold by
Raye Lucille M and Raye Kenneth M
Bought by
Access Properties Inc
Home Financials for this Owner
Home Financials are based on the most recent Mortgage that was taken out on this home.
Original Mortgage
$111,600
Interest Rate
7.55%
Create a Home Valuation Report for This Property
The Home Valuation Report is an in-depth analysis detailing your home's value as well as a comparison with similar homes in the area
Home Values in the Area
Average Home Value in this Area
Purchase History
| Date | Buyer | Sale Price | Title Company |
|---|---|---|---|
| Bergen George E | -- | Amrock Inc | |
| Godley Rena | $154,900 | Insight Title | |
| Access Properties Inc | $139,500 | -- | |
| Access Properties Inc | -- | -- |
Source: Public Records
Mortgage History
| Date | Status | Borrower | Loan Amount |
|---|---|---|---|
| Open | Bergen George E | $176,000 | |
| Closed | Godley Rena | $145,400 | |
| Previous Owner | Access Properties Inc | $111,600 |
Source: Public Records
Tax History Compared to Growth
Tax History
| Year | Tax Paid | Tax Assessment Tax Assessment Total Assessment is a certain percentage of the fair market value that is determined by local assessors to be the total taxable value of land and additions on the property. | Land | Improvement |
|---|---|---|---|---|
| 2025 | $5,345 | $96,540 | $86,170 | $10,370 |
| 2024 | $5,345 | $85,140 | $52,670 | $32,470 |
| 2023 | $5,261 | $85,140 | $52,670 | $32,470 |
| 2022 | $5,583 | $84,340 | $50,220 | $34,120 |
| 2021 | $5,511 | $84,340 | $50,220 | $34,120 |
| 2020 | $3,283 | $48,150 | $46,630 | $1,520 |
| 2019 | $3,283 | $48,150 | $46,630 | $1,520 |
| 2018 | $3,287 | $42,580 | $34,300 | $8,280 |
| 2017 | $3,283 | $42,580 | $34,300 | $8,280 |
| 2016 | $2,439 | $31,790 | $26,700 | $5,090 |
| 2015 | $2,437 | $31,790 | $26,700 | $5,090 |
| 2014 | $2,271 | $28,960 | $12,050 | $16,910 |
Source: Public Records
Map
Nearby Homes
- 1041 N Clay Ave Unit 19
- 212 Wilson Ave
- 187 Doorack Ln
- 830 N Clay Ave
- 930 Evans Ave
- 1133 N Harrison Ave
- 1137 N Harrison Ave
- 125 Swan Ave
- 976 Cleveland Ave
- 803 N Kirkwood Rd
- 823 N Harrison Ave
- 1030 Sylvan Place
- 1120 Simmons Ave
- 812 Cleveland Ave
- 966 N Geyer Rd
- 841 N Geyer Rd
- 535 Kirkshire Dr
- 936 Poinsetta Ln
- 1003 Ormond Dr
- 551 Brookhaven Ct
- 118 W Sarah Ave
- 122 W Sarah Ave
- 115 Wilson Ave
- 126 W Sarah Ave
- 119 Wilson Ave
- 119 W Sarah Ave
- 132 W Sarah Ave
- 123 W Sarah Ave
- 121 Wilson Ave
- 129 W Sarah Ave
- 136 W Sarah Ave
- 125 Wilson Ave
- 133 W Sarah Ave
- 129 Wilson Ave
- 100 Wilson Ave
- 140 W Sarah Ave
- 112 Wilson Ave
- 137 W Sarah Ave
- 106 Wilson Ave
- 116 Wilson Ave