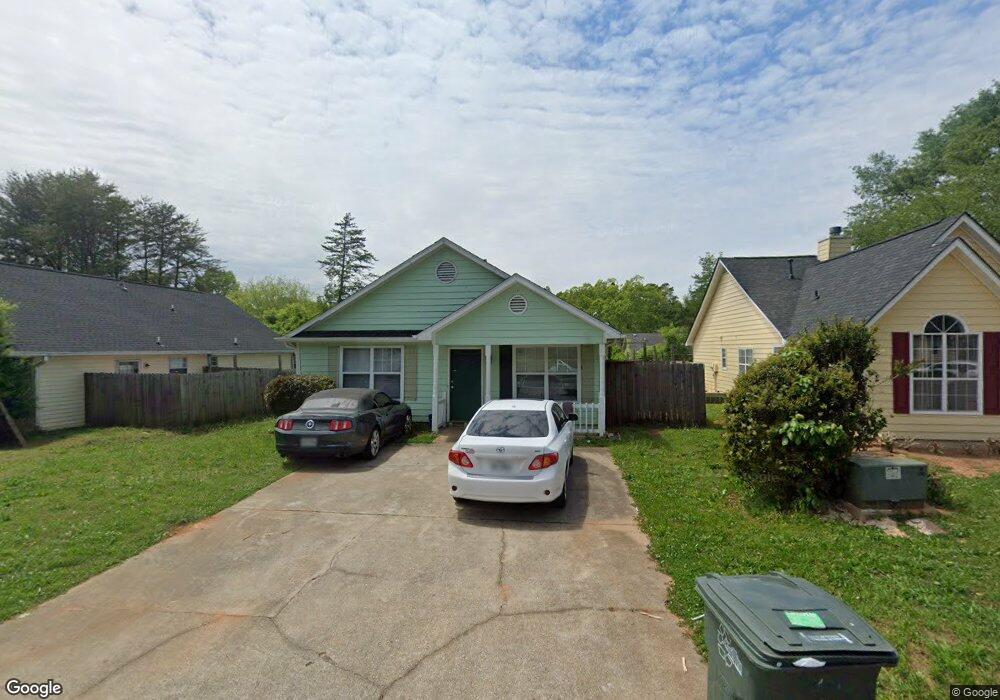
114 Wedgewood Walk Unit 1 Griffin, GA 30223
Spalding County NeighborhoodEstimated Value: $155,963 - $173,000
--
Bed
2
Baths
1,092
Sq Ft
$150/Sq Ft
Est. Value
About This Home
This home is located at 114 Wedgewood Walk Unit 1, Griffin, GA 30223 and is currently estimated at $164,241, approximately $150 per square foot. 114 Wedgewood Walk Unit 1 is a home located in Spalding County with nearby schools including Cowan Road Elementary School, Cowan Road Middle School, and Griffin High School.
Ownership History
Date
Name
Owned For
Owner Type
Purchase Details
Closed on
Nov 27, 2019
Sold by
Dunson Properties Llc
Bought by
Waterford Schorr 1 Llc
Current Estimated Value
Purchase Details
Closed on
Dec 15, 2014
Sold by
Dunson Dan L
Bought by
Dunson Properties Llc
Purchase Details
Closed on
Nov 19, 1993
Sold by
Eagle Investment and Jenkins Raymond J
Bought by
Jenkins Andrea L
Home Financials for this Owner
Home Financials are based on the most recent Mortgage that was taken out on this home.
Original Mortgage
$61,079
Interest Rate
6.81%
Mortgage Type
FHA
Purchase Details
Closed on
Nov 30, 1992
Sold by
Bob Dixon Builders Inc
Bought by
Eagle Investment Group Inc
Purchase Details
Closed on
Nov 19, 1992
Sold by
Eagle Investment Group Inc
Bought by
Jenkins Raymond J and Jenkins Andrea L
Create a Home Valuation Report for This Property
The Home Valuation Report is an in-depth analysis detailing your home's value as well as a comparison with similar homes in the area
Home Values in the Area
Average Home Value in this Area
Purchase History
| Date | Buyer | Sale Price | Title Company |
|---|---|---|---|
| Waterford Schorr 1 Llc | $1,363,250 | -- | |
| Dunson Properties Llc | -- | -- | |
| Jenkins Andrea L | $61,900 | -- | |
| Eagle Investment Group Inc | $11,500 | -- | |
| Jenkins Raymond J | $61,900 | -- |
Source: Public Records
Mortgage History
| Date | Status | Borrower | Loan Amount |
|---|---|---|---|
| Previous Owner | Jenkins Andrea L | $61,079 |
Source: Public Records
Tax History Compared to Growth
Tax History
| Year | Tax Paid | Tax Assessment Tax Assessment Total Assessment is a certain percentage of the fair market value that is determined by local assessors to be the total taxable value of land and additions on the property. | Land | Improvement |
|---|---|---|---|---|
| 2024 | $1,434 | $37,175 | $3,200 | $33,975 |
| 2023 | $1,486 | $37,175 | $3,200 | $33,975 |
| 2022 | $751 | $18,797 | $3,133 | $15,664 |
| 2021 | $751 | $18,797 | $3,133 | $15,664 |
| 2020 | $751 | $18,797 | $3,133 | $15,664 |
| 2019 | $603 | $14,811 | $3,200 | $11,611 |
| 2018 | $576 | $13,646 | $3,200 | $10,446 |
| 2017 | $593 | $14,342 | $3,200 | $11,142 |
| 2016 | $512 | $14,342 | $3,200 | $11,142 |
| 2015 | $580 | $13,588 | $2,800 | $10,788 |
| 2014 | $693 | $15,762 | $8,000 | $7,762 |
Source: Public Records
Map
Nearby Homes
- 116 Crystal Brook
- 86 Crystal Brook Unit 3
- 82 Crystal Brook
- 164 Crystal Brook
- 115 1st Ave
- 1391 Experiment St Unit 12
- 1391 Experiment St
- 4038 W Mcintosh Rd
- 602 Melrose Ave
- 1464 Beatty St
- 116 Peachtree St
- 65 Elm St
- 121 Peachtree St
- 202 Cheatham St
- 1652 Hallmark Hills Dr
- 1643 Hallmark Hills Dr
- 2 Cedar Ave
- 1807 Ridge St
- 1804, 1796 W Mcintosh Rd
- 1812 W Mcintosh Rd
- 112 Wedgewood Walk
- 0 Wedgewood Walk
- 110 Wedgewood Walk
- 118 Wedgewood Walk
- 120 Crystal Brook
- 114 Crystal Brook
- 122 Crystal Brook Unit 1
- 120 Wedgewood Walk
- 117 Wedgewood Walk
- 115 Wedgewood Walk
- 108 Wedgewood Walk
- 113 Wedgewood Walk
- 325 Crystal Brook
- 0 Crystal Brook Unit 8545857
- 0 Crystal Brook Unit 8279611
- 0 Crystal Brook Unit 8320426
- 0 Crystal Brook Unit 8262289
- 0 Crystal Brook Unit 8988026
- 0 Crystal Brook Unit 9004505
- 0 Crystal Brook Unit 9064002