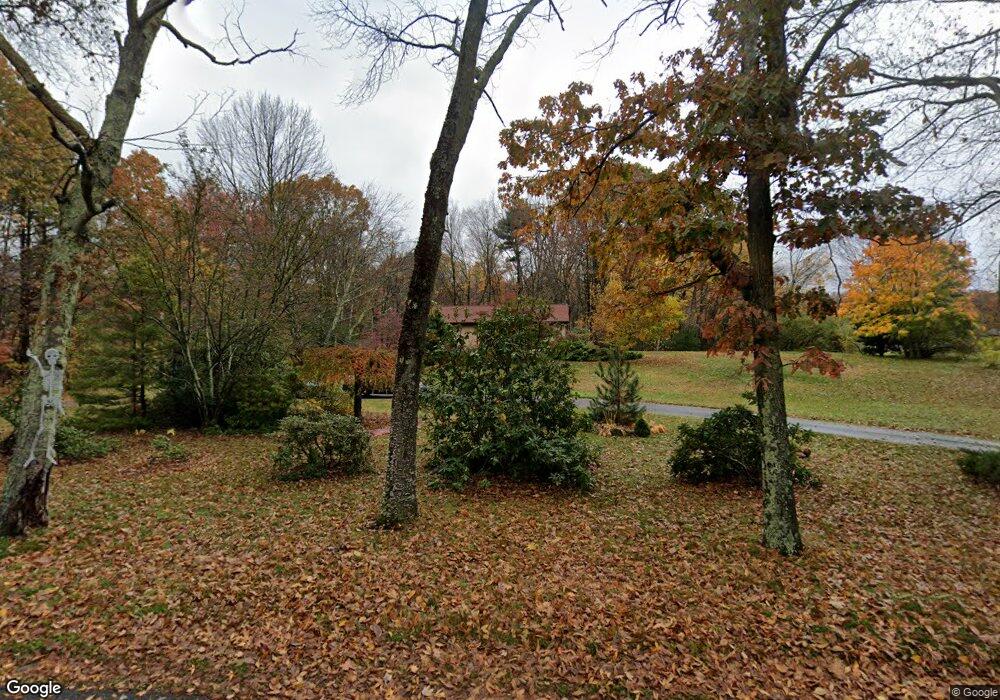
114 West St Uxbridge, MA 01569
Estimated Value: $489,003 - $595,000
3
Beds
1
Bath
1,300
Sq Ft
$422/Sq Ft
Est. Value
About This Home
This home is located at 114 West St, Uxbridge, MA 01569 and is currently estimated at $548,501, approximately $421 per square foot. 114 West St is a home located in Worcester County with nearby schools including Uxbridge High School.
Ownership History
Date
Name
Owned For
Owner Type
Purchase Details
Closed on
Nov 16, 2007
Sold by
Renault Eileen A
Bought by
Chludzinska Grazyna and Wisniewski Jerzy
Current Estimated Value
Home Financials for this Owner
Home Financials are based on the most recent Mortgage that was taken out on this home.
Original Mortgage
$130,000
Interest Rate
6.41%
Mortgage Type
Purchase Money Mortgage
Purchase Details
Closed on
Jul 30, 1996
Sold by
Wires Bruce C
Bought by
Murphy Peter J
Home Financials for this Owner
Home Financials are based on the most recent Mortgage that was taken out on this home.
Original Mortgage
$111,180
Interest Rate
8.37%
Mortgage Type
Purchase Money Mortgage
Purchase Details
Closed on
Oct 26, 1989
Sold by
Hill Geoffrey
Bought by
Wires Bruce
Home Financials for this Owner
Home Financials are based on the most recent Mortgage that was taken out on this home.
Original Mortgage
$90,000
Interest Rate
9.94%
Mortgage Type
Purchase Money Mortgage
Create a Home Valuation Report for This Property
The Home Valuation Report is an in-depth analysis detailing your home's value as well as a comparison with similar homes in the area
Home Values in the Area
Average Home Value in this Area
Purchase History
| Date | Buyer | Sale Price | Title Company |
|---|---|---|---|
| Chludzinska Grazyna | $265,500 | -- | |
| Murphy Peter J | $109,000 | -- | |
| Wires Bruce | $120,000 | -- |
Source: Public Records
Mortgage History
| Date | Status | Borrower | Loan Amount |
|---|---|---|---|
| Open | Wires Bruce | $132,000 | |
| Closed | Chludzinska Grazyna | $130,000 | |
| Previous Owner | Wires Bruce | $111,180 | |
| Previous Owner | Wires Bruce | $90,000 |
Source: Public Records
Tax History Compared to Growth
Tax History
| Year | Tax Paid | Tax Assessment Tax Assessment Total Assessment is a certain percentage of the fair market value that is determined by local assessors to be the total taxable value of land and additions on the property. | Land | Improvement |
|---|---|---|---|---|
| 2025 | $53 | $404,400 | $181,500 | $222,900 |
| 2024 | $4,844 | $374,900 | $172,800 | $202,100 |
| 2023 | $4,408 | $316,000 | $148,600 | $167,400 |
| 2022 | $4,278 | $282,200 | $131,200 | $151,000 |
| 2021 | $4,423 | $279,600 | $128,600 | $151,000 |
| 2020 | $4,550 | $271,800 | $126,800 | $145,000 |
| 2019 | $4,665 | $268,900 | $126,800 | $142,100 |
| 2018 | $4,411 | $256,900 | $126,800 | $130,100 |
| 2017 | $3,475 | $204,900 | $117,100 | $87,800 |
| 2016 | $3,721 | $211,800 | $111,800 | $100,000 |
| 2015 | $3,651 | $209,800 | $111,800 | $98,000 |
Source: Public Records
Map
Nearby Homes
- 103 Uxbridge St
- 138 Mantell Rd
- 145 Mantell Rd
- 169 Mantell Rd
- 137 Mantell Rd
- 153 Davis St
- 33 Summerfield Dr Unit 33
- 405 West St
- 60 Tyler Dr
- 395 High St
- Layla Plan at Pine Ridge
- Ashley Plan at Pine Ridge
- Lily Plan at Pine Ridge
- Brooklyn Plan at Pine Ridge
- Tucker Plan at Pine Ridge
- Everleigh Plan at Pine Ridge
- 99 Maple St
- 100 Spring Hill Dr Unit 100
- 104 Eber Taft Rd
- 2 C St