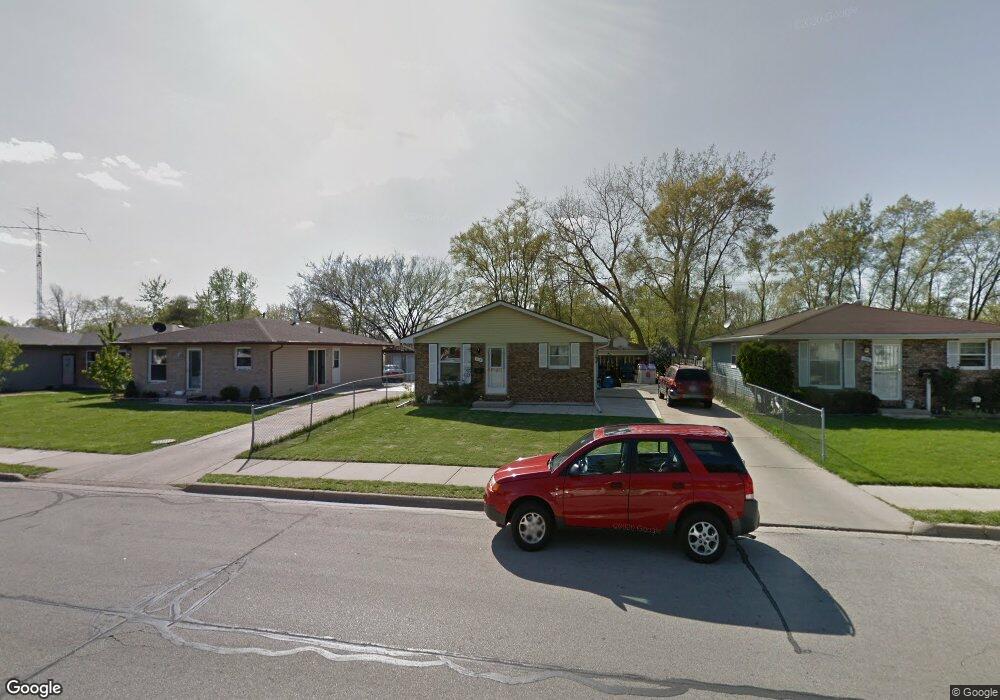
1140 High St Aurora, IL 60505
Pigeon Hill NeighborhoodEstimated Value: $258,000 - $326,000
3
Beds
1
Bath
1,066
Sq Ft
$262/Sq Ft
Est. Value
About This Home
This home is located at 1140 High St, Aurora, IL 60505 and is currently estimated at $279,557, approximately $262 per square foot. 1140 High St is a home located in Kane County with nearby schools including Nicholas A Hermes Elementary School, Simmons Middle School, and East Aurora High School.
Ownership History
Date
Name
Owned For
Owner Type
Purchase Details
Closed on
Jan 20, 2021
Sold by
Cervantes Jose A and Cervantes Adan
Bought by
Cerbantes Adan and Cerbantes Maria
Current Estimated Value
Home Financials for this Owner
Home Financials are based on the most recent Mortgage that was taken out on this home.
Original Mortgage
$91,000
Outstanding Balance
$81,346
Interest Rate
2.8%
Mortgage Type
New Conventional
Estimated Equity
$198,211
Purchase Details
Closed on
Sep 26, 2014
Sold by
Cervantes Adan and Lopez Martha M
Bought by
Cervantes Adan and Cervantes Jose A
Home Financials for this Owner
Home Financials are based on the most recent Mortgage that was taken out on this home.
Original Mortgage
$103,423
Interest Rate
4.12%
Mortgage Type
FHA
Purchase Details
Closed on
Oct 29, 2001
Sold by
Hart Robert L and Hart Anneliese
Bought by
Cervantes Adan and Cervantes Martha
Home Financials for this Owner
Home Financials are based on the most recent Mortgage that was taken out on this home.
Original Mortgage
$126,976
Interest Rate
6.8%
Mortgage Type
FHA
Create a Home Valuation Report for This Property
The Home Valuation Report is an in-depth analysis detailing your home's value as well as a comparison with similar homes in the area
Home Values in the Area
Average Home Value in this Area
Purchase History
| Date | Buyer | Sale Price | Title Company |
|---|---|---|---|
| Cerbantes Adan | -- | Citywide Title Corp | |
| Cervantes Adan | -- | Plymouth Title Guaranty Corp | |
| Cervantes Adan | $129,000 | First American Title Co |
Source: Public Records
Mortgage History
| Date | Status | Borrower | Loan Amount |
|---|---|---|---|
| Open | Cerbantes Adan | $91,000 | |
| Closed | Cervantes Adan | $103,423 | |
| Closed | Cervantes Adan | $126,976 |
Source: Public Records
Tax History
| Year | Tax Paid | Tax Assessment Tax Assessment Total Assessment is a certain percentage of the fair market value that is determined by local assessors to be the total taxable value of land and additions on the property. | Land | Improvement |
|---|---|---|---|---|
| 2024 | $4,416 | $72,418 | $8,431 | $63,987 |
| 2023 | $4,238 | $64,705 | $7,533 | $57,172 |
| 2022 | $4,030 | $59,037 | $6,873 | $52,164 |
| 2021 | $3,953 | $54,964 | $6,399 | $48,565 |
| 2020 | $3,747 | $51,054 | $5,944 | $45,110 |
| 2019 | $3,841 | $49,591 | $5,507 | $44,084 |
| 2018 | $3,889 | $42,710 | $5,094 | $37,616 |
| 2017 | $3,726 | $37,993 | $4,694 | $33,299 |
| 2016 | $3,617 | $34,371 | $4,734 | $29,637 |
| 2015 | -- | $32,594 | $4,071 | $28,523 |
| 2014 | -- | $31,174 | $3,741 | $27,433 |
| 2013 | -- | $32,141 | $3,972 | $28,169 |
Source: Public Records
Map
Nearby Homes
- 1009 Assell Ave
- 1220 Mitchell Rd
- 304 Hankes Ave
- 773 Aurora Ave
- 14-18 N Lake St
- 1567 Galway Dr
- 907 Harley Ct
- 338 Lakelawn Blvd
- 0000 N Farnsworth Ave
- 341 Woodlyn Dr Unit 3
- 1923 Schomer Ct
- 440 Woodlyn Dr
- 388 Manor Place
- 608 Front St
- 747 Delius St
- Lot 1 Reckinger Rd
- 1050 N Farnsworth Ave Unit 111
- 461 Wood St
- 231-233 Williams St
- 971 Solfisburg Ave
Your Personal Tour Guide
Ask me questions while you tour the home.