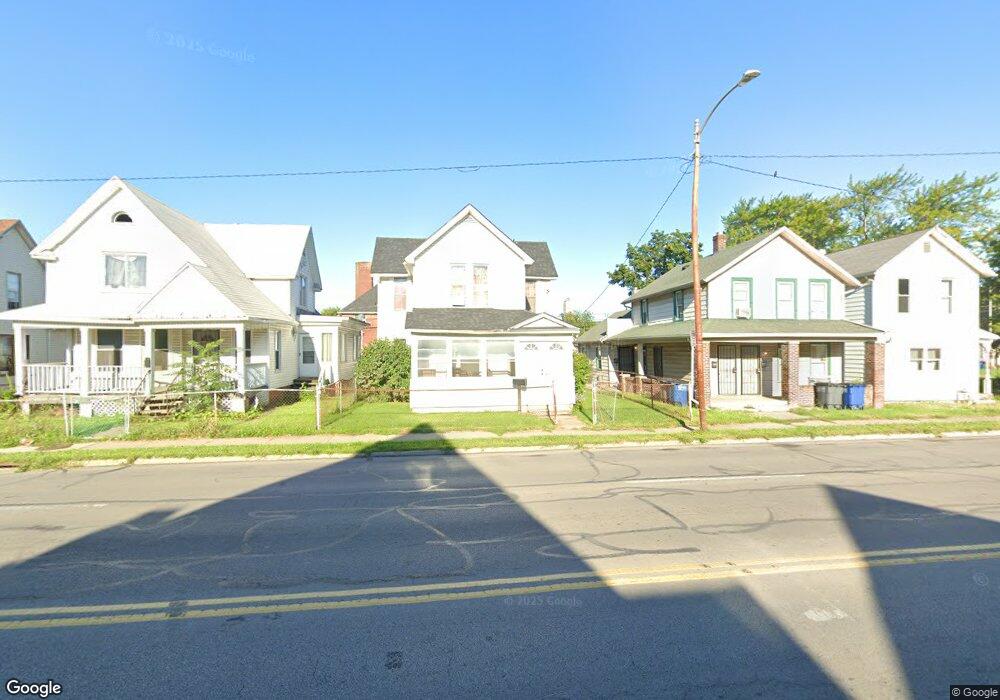
1140 Oak St Toledo, OH 43605
East Toledo NeighborhoodEstimated Value: $65,557 - $86,000
4
Beds
1
Bath
1,448
Sq Ft
$53/Sq Ft
Est. Value
About This Home
This home is located at 1140 Oak St, Toledo, OH 43605 and is currently estimated at $77,389, approximately $53 per square foot. 1140 Oak St is a home located in Lucas County with nearby schools including Oakdale Elementary School, Waite High School, and L. Hollingworth School For Talented And Gifted.
Ownership History
Date
Name
Owned For
Owner Type
Purchase Details
Closed on
Feb 21, 2020
Sold by
Phillips Marissa Ann
Bought by
Phillips Charles R
Current Estimated Value
Purchase Details
Closed on
Sep 21, 2004
Sold by
Phillips Charles R and Phillips Richard F
Bought by
Phillips Charles R
Purchase Details
Closed on
Jul 13, 2004
Sold by
Phillips Charles R
Bought by
Phillips Charles R and Phillips Richard F
Purchase Details
Closed on
Jun 23, 2004
Sold by
Estate Of Wanda Phillips
Bought by
Phillips Charles R
Purchase Details
Closed on
Jun 9, 2004
Sold by
Phillips Charles R and Phillips Charles
Bought by
Phillips Charles R
Create a Home Valuation Report for This Property
The Home Valuation Report is an in-depth analysis detailing your home's value as well as a comparison with similar homes in the area
Home Values in the Area
Average Home Value in this Area
Purchase History
| Date | Buyer | Sale Price | Title Company |
|---|---|---|---|
| Phillips Charles R | $300 | None Available | |
| Phillips Charles R | $16,500 | Metro Title Agency Inc | |
| Phillips Charles R | -- | -- | |
| Phillips Charles R | -- | -- | |
| Phillips Charles R | -- | -- |
Source: Public Records
Tax History Compared to Growth
Tax History
| Year | Tax Paid | Tax Assessment Tax Assessment Total Assessment is a certain percentage of the fair market value that is determined by local assessors to be the total taxable value of land and additions on the property. | Land | Improvement |
|---|---|---|---|---|
| 2024 | $225 | $14,140 | $1,925 | $12,215 |
| 2023 | $344 | $11,690 | $3,010 | $8,680 |
| 2022 | $355 | $11,690 | $3,010 | $8,680 |
| 2021 | $329 | $11,690 | $3,010 | $8,680 |
| 2020 | $281 | $10,220 | $2,590 | $7,630 |
| 2019 | $270 | $10,220 | $2,590 | $7,630 |
| 2018 | $242 | $10,220 | $2,590 | $7,630 |
| 2017 | $569 | $9,975 | $2,520 | $7,455 |
| 2016 | $252 | $28,500 | $7,200 | $21,300 |
| 2015 | $223 | $28,500 | $7,200 | $21,300 |
| 2014 | $67 | $9,810 | $2,490 | $7,320 |
| 2013 | $67 | $9,810 | $2,490 | $7,320 |
Source: Public Records
Map
Nearby Homes