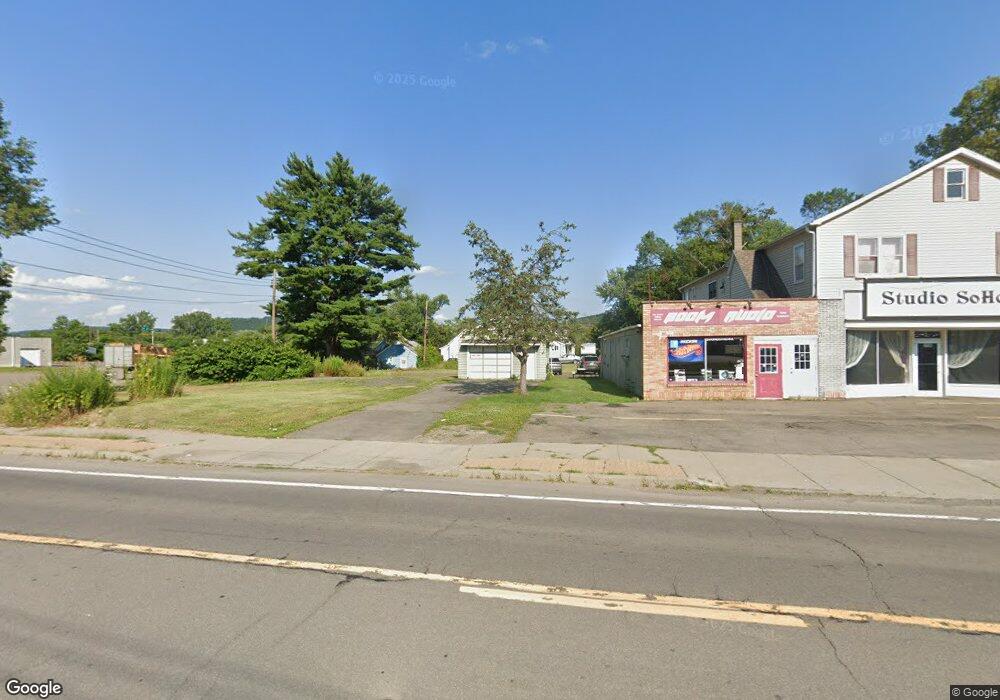
1140 Upper Front St Binghamton, NY 13905
Estimated Value: $219,567
2
Beds
1
Bath
900
Sq Ft
$244/Sq Ft
Est. Value
About This Home
This home is located at 1140 Upper Front St, Binghamton, NY 13905 and is currently estimated at $219,567, approximately $243 per square foot. 1140 Upper Front St is a home located in Broome County with nearby schools including Port Dickinson Elementary School, Chenango Bridge Elementary School, and Chenango Valley Middle School.
Ownership History
Date
Name
Owned For
Owner Type
Purchase Details
Closed on
Apr 20, 2015
Sold by
Conroy Stephen E
Bought by
Cbo Ventures Llc
Current Estimated Value
Purchase Details
Closed on
Aug 5, 2005
Sold by
Asolare Ii Llc
Bought by
Flannery John
Purchase Details
Closed on
May 20, 2005
Sold by
Campbell
Bought by
Conroy Stephen
Purchase Details
Closed on
Nov 30, 2004
Sold by
Levine Esq Tstee Paul
Bought by
Asolare Ii Llc
Create a Home Valuation Report for This Property
The Home Valuation Report is an in-depth analysis detailing your home's value as well as a comparison with similar homes in the area
Home Values in the Area
Average Home Value in this Area
Purchase History
| Date | Buyer | Sale Price | Title Company |
|---|---|---|---|
| Cbo Ventures Llc | $117,000 | Richard C. Lewis, Esq. | |
| Cbo Ventures Llc | $117,000 | None Available | |
| Flannery John | $75,000 | David Guy | |
| Conroy Stephen | $50,000 | Donald Walls | |
| Asolare Ii Llc | -- | James Towne |
Source: Public Records
Tax History Compared to Growth
Tax History
| Year | Tax Paid | Tax Assessment Tax Assessment Total Assessment is a certain percentage of the fair market value that is determined by local assessors to be the total taxable value of land and additions on the property. | Land | Improvement |
|---|---|---|---|---|
| 2024 | $1,685 | $28,000 | $16,000 | $12,000 |
| 2023 | $1,778 | $28,000 | $16,000 | $12,000 |
| 2022 | $1,723 | $28,000 | $16,000 | $12,000 |
| 2021 | $1,675 | $28,000 | $16,000 | $12,000 |
| 2020 | $1,657 | $28,000 | $16,000 | $12,000 |
| 2019 | -- | $28,000 | $16,000 | $12,000 |
| 2018 | $1,558 | $28,000 | $16,000 | $12,000 |
| 2017 | $1,558 | $28,000 | $16,000 | $12,000 |
| 2016 | $2,624 | $47,700 | $16,000 | $31,700 |
| 2015 | -- | $47,700 | $16,000 | $31,700 |
| 2014 | -- | $47,700 | $16,000 | $31,700 |
Source: Public Records
Map
Nearby Homes