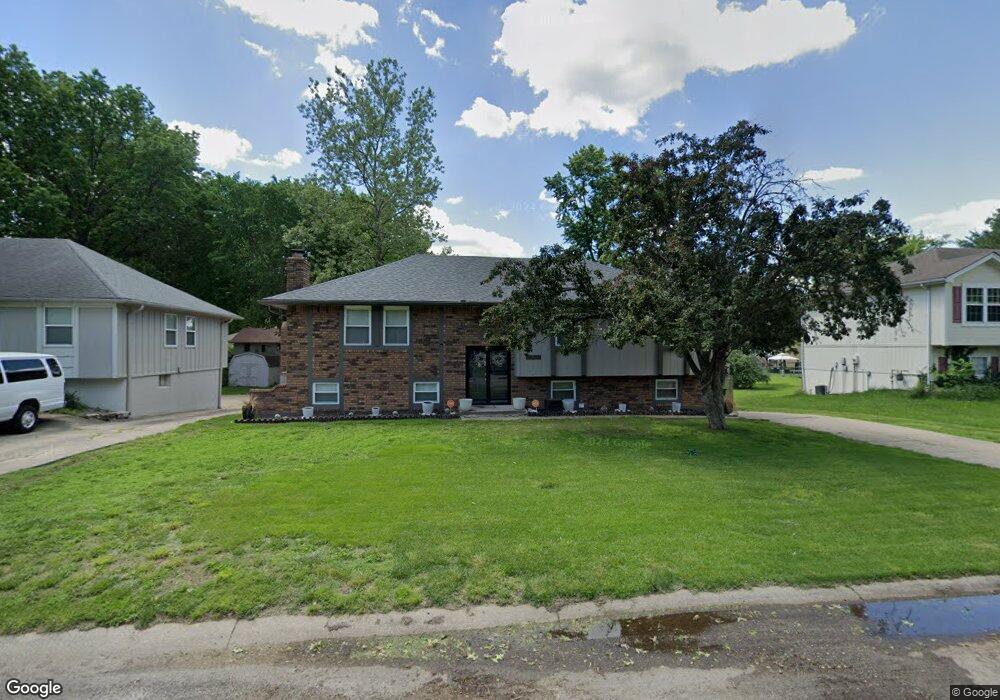
11401 E 58th St Raytown, MO 64133
Estimated Value: $248,686 - $262,000
3
Beds
3
Baths
1,450
Sq Ft
$177/Sq Ft
Est. Value
About This Home
This home is located at 11401 E 58th St, Raytown, MO 64133 and is currently estimated at $256,672, approximately $177 per square foot. 11401 E 58th St is a home located in Jackson County with nearby schools including Fleetridge Elementary School, Raytown Middle School, and Raytown South High School.
Ownership History
Date
Name
Owned For
Owner Type
Purchase Details
Closed on
Feb 17, 2005
Sold by
Lang Raymond Eugene and Lang Linda Marie
Bought by
Frazier Steven D and Frazier Cherhea M
Current Estimated Value
Home Financials for this Owner
Home Financials are based on the most recent Mortgage that was taken out on this home.
Original Mortgage
$113,920
Outstanding Balance
$63,470
Interest Rate
7.24%
Mortgage Type
Stand Alone First
Estimated Equity
$193,202
Purchase Details
Closed on
Jan 7, 2005
Sold by
Plesser Donald G and Plesser Teresa A
Bought by
Greg Stervinou Construction Co
Home Financials for this Owner
Home Financials are based on the most recent Mortgage that was taken out on this home.
Original Mortgage
$113,920
Outstanding Balance
$63,470
Interest Rate
7.24%
Mortgage Type
Stand Alone First
Estimated Equity
$193,202
Purchase Details
Closed on
May 8, 2002
Sold by
Hughes John P
Bought by
Plesser Donald G and Plesser Teresa A
Create a Home Valuation Report for This Property
The Home Valuation Report is an in-depth analysis detailing your home's value as well as a comparison with similar homes in the area
Home Values in the Area
Average Home Value in this Area
Purchase History
| Date | Buyer | Sale Price | Title Company |
|---|---|---|---|
| Frazier Steven D | -- | Ctic | |
| Greg Stervinou Construction Co | -- | Columbian Title Of Kansas Ci | |
| Plesser Donald G | -- | -- |
Source: Public Records
Mortgage History
| Date | Status | Borrower | Loan Amount |
|---|---|---|---|
| Open | Frazier Steven D | $113,920 |
Source: Public Records
Tax History
| Year | Tax Paid | Tax Assessment Tax Assessment Total Assessment is a certain percentage of the fair market value that is determined by local assessors to be the total taxable value of land and additions on the property. | Land | Improvement |
|---|---|---|---|---|
| 2025 | $3,175 | $34,926 | $6,240 | $28,686 |
| 2024 | $3,153 | $35,192 | $4,150 | $31,042 |
| 2023 | $3,153 | $35,192 | $2,810 | $32,382 |
| 2022 | $2,484 | $26,410 | $4,845 | $21,565 |
| 2021 | $2,493 | $26,410 | $4,845 | $21,565 |
| 2020 | $2,388 | $25,056 | $4,845 | $20,211 |
| 2019 | $2,375 | $25,056 | $4,845 | $20,211 |
| 2018 | $2,131 | $23,287 | $5,729 | $17,558 |
| 2017 | $2,131 | $23,287 | $5,729 | $17,558 |
| 2016 | $2,085 | $22,917 | $2,740 | $20,177 |
Source: Public Records
Map
Nearby Homes
- 5813 Harvard Ave
- 5608 Woodson Rd
- 5933 Sterling Ave
- 10905 E 59th St
- 6100 Englewood Ave
- 11213 E 61st St
- 12000 E 56th Terrace
- 10909 E 60th Terrace
- 5425 Appleton Ave
- 11601 E 62nd St
- 6215 Sterling Ave
- 6207 Hedges Ave
- 11013 E 53rd Terrace
- 5305 Ridgeway Ave
- 5821 Marion Ave
- 5433 Willow Ave
- 6121 Willow Ave
- 12124 E 54th St
- 6322 Norwood Ct
- 6009 Marion Ave
- 11407 E 58th St
- 11321 E 58th St
- 11413 E 58th St
- 11400 E 58th St
- 11317 E 58th St
- 11400 E 58th Terrace
- 11406 E 58th Terrace
- 11316 E 58th St
- 11320 E 58th Terrace
- 11419 E 58th St
- 11412 E 58th St
- 11312 E 58th St
- 11412 E 58th Terrace
- 11313 E 58th St
- 11316 E 58th Terrace
- 11418 E 58th St
- 11418 E 58th Terrace
- 11312 E 58th Terrace
- 11407 E 57th Terrace
- 11403 E 57th Terrace
Your Personal Tour Guide
Ask me questions while you tour the home.