11405 Baywood Moultrie, OH 44657
Estimated Value: $116,000 - $130,000
3
Beds
2
Baths
1,496
Sq Ft
$83/Sq Ft
Est. Value
About This Home
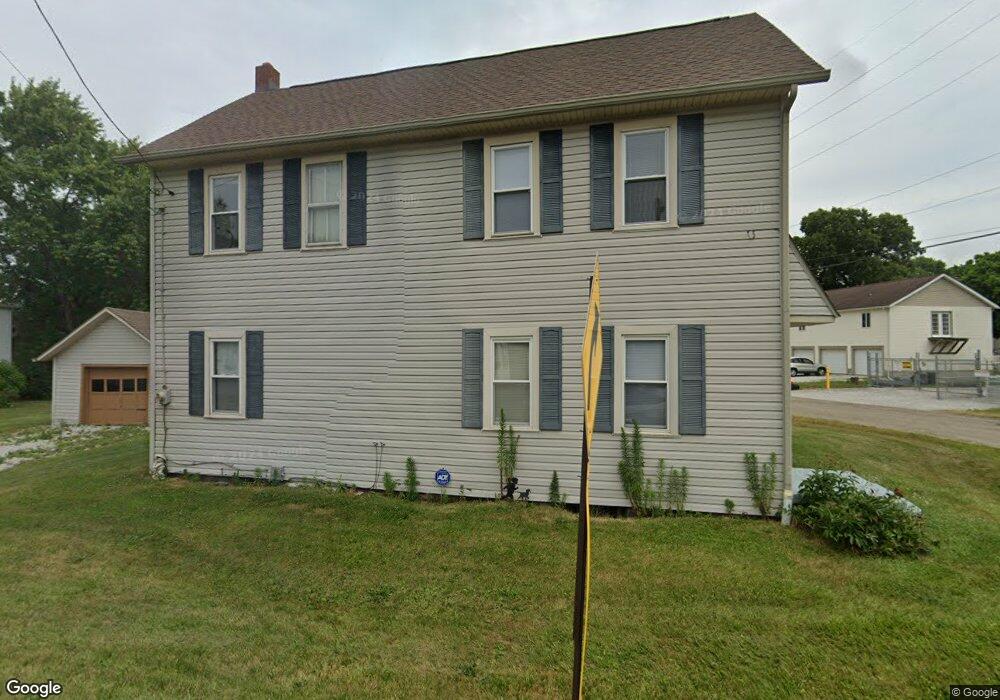
This home is located at 11405 Baywood, Moultrie, OH 44657 and is currently estimated at $124,660, approximately $83 per square foot. 11405 Baywood is a home located in Stark County with nearby schools including Minerva Elementary School, Minerva Middle School, and Minerva High School.
Ownership History
Date
Name
Owned For
Owner Type
Purchase Details
Closed on
Jun 27, 2024
Sold by
Burns Christopher D
Bought by
Finlayson Jordon Avery and Moore Anna
Current Estimated Value
Home Financials for this Owner
Home Financials are based on the most recent Mortgage that was taken out on this home.
Original Mortgage
$117,826
Outstanding Balance
$116,427
Interest Rate
7.02%
Mortgage Type
FHA
Estimated Equity
$8,233
Purchase Details
Closed on
May 11, 2010
Sold by
Drew Nikki
Bought by
Burns Christopher D
Home Financials for this Owner
Home Financials are based on the most recent Mortgage that was taken out on this home.
Original Mortgage
$49,094
Interest Rate
5.05%
Mortgage Type
FHA
Purchase Details
Closed on
Sep 25, 2009
Sold by
Fannie Mae
Bought by
Drew Nikki
Purchase Details
Closed on
Jul 21, 2009
Sold by
Grubbs Nick
Bought by
Federal National Mortgage Association
Purchase Details
Closed on
Sep 30, 1999
Sold by
Marriner Dennis
Bought by
Grubbs Nick and Tate Bianca
Home Financials for this Owner
Home Financials are based on the most recent Mortgage that was taken out on this home.
Original Mortgage
$46,800
Interest Rate
7.87%
Mortgage Type
Purchase Money Mortgage
Create a Home Valuation Report for This Property
The Home Valuation Report is an in-depth analysis detailing your home's value as well as a comparison with similar homes in the area
Home Values in the Area
Average Home Value in this Area
Purchase History
| Date | Buyer | Sale Price | Title Company |
|---|---|---|---|
| Finlayson Jordon Avery | $120,000 | None Listed On Document | |
| Burns Christopher D | $50,000 | Attorney | |
| Drew Nikki | $12,500 | None Available | |
| Federal National Mortgage Association | $54,759 | None Available | |
| Grubbs Nick | $52,000 | -- |
Source: Public Records
Mortgage History
| Date | Status | Borrower | Loan Amount |
|---|---|---|---|
| Open | Finlayson Jordon Avery | $117,826 | |
| Previous Owner | Burns Christopher D | $49,094 | |
| Previous Owner | Grubbs Nick | $46,800 |
Source: Public Records
Tax History Compared to Growth
Tax History
| Year | Tax Paid | Tax Assessment Tax Assessment Total Assessment is a certain percentage of the fair market value that is determined by local assessors to be the total taxable value of land and additions on the property. | Land | Improvement |
|---|---|---|---|---|
| 2025 | -- | $31,080 | $9,380 | $21,700 |
| 2024 | -- | $31,080 | $9,380 | $21,700 |
| 2023 | $1,210 | $26,540 | $5,430 | $21,110 |
| 2022 | $1,220 | $26,540 | $5,430 | $21,110 |
| 2021 | $1,226 | $26,540 | $5,430 | $21,110 |
| 2020 | $1,172 | $23,810 | $4,800 | $19,010 |
| 2019 | $936 | $23,810 | $4,800 | $19,010 |
| 2018 | $1,026 | $23,810 | $4,800 | $19,010 |
| 2017 | $928 | $20,660 | $4,590 | $16,070 |
| 2016 | $858 | $18,210 | $4,590 | $13,620 |
| 2015 | $895 | $18,210 | $4,590 | $13,620 |
| 2014 | $811 | $15,340 | $3,850 | $11,490 |
| 2013 | $411 | $15,340 | $3,850 | $11,490 |
Source: Public Records
Map
Nearby Homes
- 2079 Parks Ave SE
- 10400 Lincoln St SE
- 12910 Lincoln St SE
- 2260 Paris Ave SE
- 756 Paris Ave SE
- 0 Neimans Ave SE Unit 5149957
- 2030 Woodland Park Ave SE
- 14000 Lincoln St SE
- 10072 Blade Rd NW
- 9275 Blade Rd NW Unit 9
- 10074 Blade Rd NW Unit 4
- 14015 Stimmel St NE
- 7145 Bluebird Rd NW
- 1990 Belfort Ave
- 1527 Johns Ave SE
- 7205 Mapleton St SE
- 0 Lincoln St SE
- 8038 Avalon Rd NW
- 0 Lincoln St SE Unit 5157308
- 0 Lincoln St SE Unit 5157344
- 11405 Baywood St SE
- 11385 Baywood St SE
- 2770 Robertsville Ave SE
- 11380 Baywood St SE
- 11396 Baywood St SE
- 2764 Robertsville Ave SE
- 2749 Robertsville Ave SE
- 11386 Baywood
- 11387 Peachlane St SE
- 2752 Robertsville Ave SE
- 11369 Peachlane St SE
- 11346 Baker St SE
- 2744 Robertsville Ave SE
- 11346 Baywood St SE
- 11392 Bowling St SE
- 2738 Robertsville Ave SE
- 2760 Applehill Ave SE
- 2731 Robertsville Ave SE
- 2785 Ellenwood Ave SE
- 2736 Applehill Ave SE