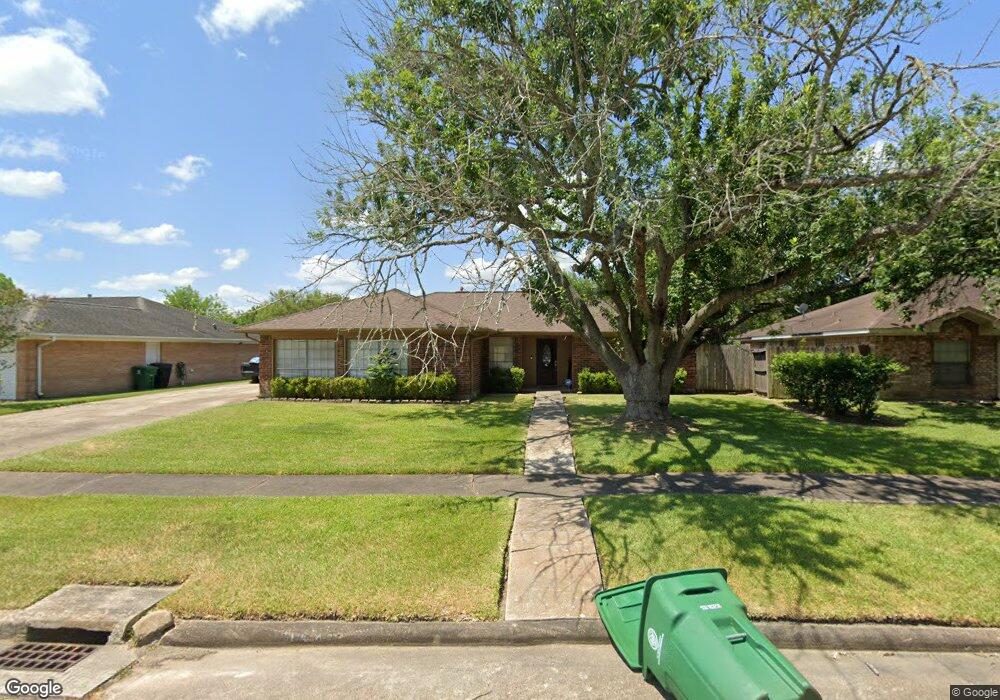
11406 Newton St Houston, TX 77089
Southbelt-Ellington NeighborhoodEstimated Value: $260,532 - $282,000
4
Beds
2
Baths
1,956
Sq Ft
$140/Sq Ft
Est. Value
About This Home
This home is located at 11406 Newton St, Houston, TX 77089 and is currently estimated at $274,633, approximately $140 per square foot. 11406 Newton St is a home located in Harris County with nearby schools including Atkinson Elementary School, Beverly Hill Intermediate School, and Morris Middle School.
Ownership History
Date
Name
Owned For
Owner Type
Purchase Details
Closed on
Sep 17, 2015
Sold by
Donnelly Daylon
Bought by
Ramirez Rubi Margarita
Current Estimated Value
Home Financials for this Owner
Home Financials are based on the most recent Mortgage that was taken out on this home.
Original Mortgage
$135,120
Outstanding Balance
$106,345
Interest Rate
3.97%
Mortgage Type
New Conventional
Estimated Equity
$168,288
Purchase Details
Closed on
Jul 17, 2014
Sold by
Klehm Kenneth
Bought by
Donnelly Daylon
Home Financials for this Owner
Home Financials are based on the most recent Mortgage that was taken out on this home.
Original Mortgage
$131,081
Interest Rate
4.25%
Mortgage Type
FHA
Purchase Details
Closed on
Mar 8, 2013
Sold by
Redman Mary E and Redman William C
Bought by
Klehm Kenneth
Purchase Details
Closed on
Jan 23, 2004
Sold by
Redman Reagan S
Bought by
Redman Mary E
Create a Home Valuation Report for This Property
The Home Valuation Report is an in-depth analysis detailing your home's value as well as a comparison with similar homes in the area
Home Values in the Area
Average Home Value in this Area
Purchase History
| Date | Buyer | Sale Price | Title Company |
|---|---|---|---|
| Ramirez Rubi Margarita | -- | Stewart Title | |
| Donnelly Daylon | -- | Stewart Title | |
| Klehm Kenneth | -- | First American Title | |
| Redman Mary E | -- | -- |
Source: Public Records
Mortgage History
| Date | Status | Borrower | Loan Amount |
|---|---|---|---|
| Open | Ramirez Rubi Margarita | $135,120 | |
| Previous Owner | Donnelly Daylon | $131,081 |
Source: Public Records
Tax History Compared to Growth
Tax History
| Year | Tax Paid | Tax Assessment Tax Assessment Total Assessment is a certain percentage of the fair market value that is determined by local assessors to be the total taxable value of land and additions on the property. | Land | Improvement |
|---|---|---|---|---|
| 2025 | $4,300 | $285,432 | $41,797 | $243,635 |
| 2024 | $4,300 | $256,723 | $41,797 | $214,926 |
| 2023 | $4,300 | $256,723 | $41,797 | $214,926 |
| 2022 | $5,998 | $233,765 | $41,797 | $191,968 |
| 2021 | $5,779 | $215,139 | $41,797 | $173,342 |
| 2020 | $5,825 | $212,510 | $41,797 | $170,713 |
| 2019 | $5,630 | $209,941 | $34,831 | $175,110 |
| 2018 | $2,047 | $177,545 | $26,819 | $150,726 |
| 2017 | $4,890 | $177,545 | $26,819 | $150,726 |
| 2016 | $4,749 | $172,436 | $26,819 | $145,617 |
| 2015 | $3,905 | $149,105 | $24,381 | $124,724 |
| 2014 | $3,905 | $139,325 | $20,898 | $118,427 |
Source: Public Records
Map
Nearby Homes
- 11414 Kirkwyn Dr
- 9743 Santa Monica Blvd
- 10406 Sagestar Ln
- 10410 Sagestar Ln
- 11311 Caribbean Ln
- 10411 Sagewillow Ln
- 9711 Ebb St
- 10415 Sagewillow Ln
- 11303 Caribbean Ln
- 10519 Sagepark Ln
- 10906 Keese Dr
- 10810 Kirkbend Dr
- 10702 Sagewillow Ln
- 10815 Ritow St
- 9039 Kirkland Dr
- 10518 Sageburrow Dr
- 10427 Sagebluff Dr
- 9407 Kingspass St
- 11107 Kirkpark Dr
- 9411 Kingsvalley St
- 11410 Newton St
- 11402 Newton St
- 11414 Newton St
- 9702 Kirkfalls Dr
- 9703 Kirkfalls Dr
- 11418 Newton St
- 9710 Kirkfalls Dr
- 9703 Kirkville Dr
- 9707 Kirkfalls Dr
- 9707 Kirkville Dr
- 9711 Kirkfalls Dr
- 9714 Kirkfalls Dr
- 9706 Grenadier Dr
- 9606 Sagemist Ct
- 9711 Kirkville Dr
- 9611 Sagemist Ct
- 9714 Grenadier Dr
- 9715 Kirkfalls Dr
- 9718 Kirkfalls Dr
- 11426 Newton St