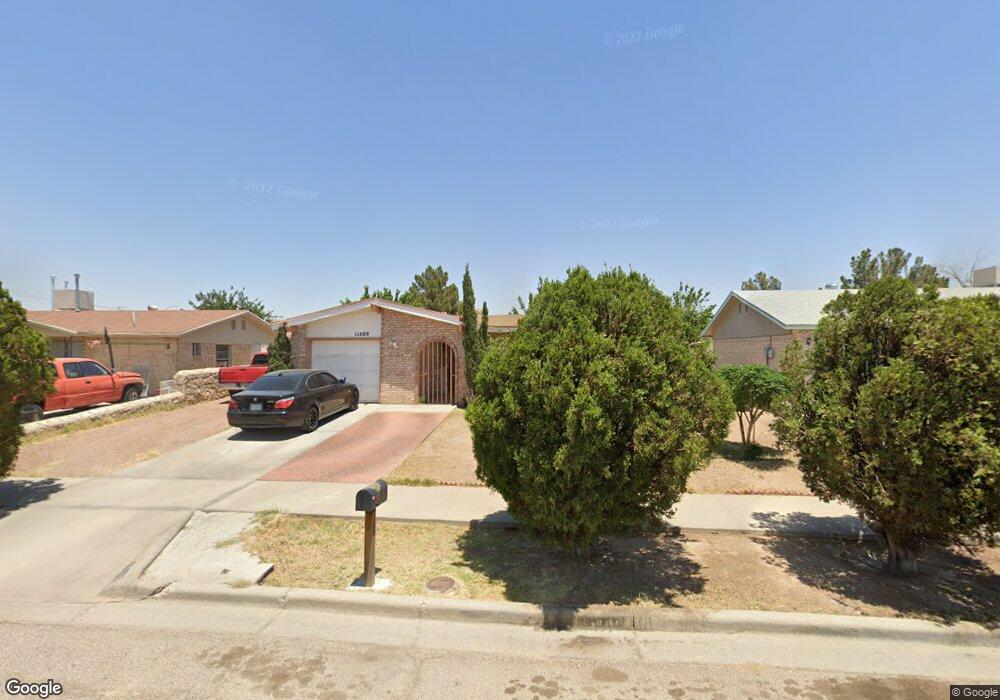
11409 Jack Cupit Ln El Paso, TX 79936
O'Shea Keleher NeighborhoodEstimated Value: $138,000 - $188,000
3
Beds
2
Baths
940
Sq Ft
$177/Sq Ft
Est. Value
About This Home
This home is located at 11409 Jack Cupit Ln, El Paso, TX 79936 and is currently estimated at $166,245, approximately $176 per square foot. 11409 Jack Cupit Ln is a home located in El Paso County with nearby schools including O'shea Keleher Elementary School, William D Slider Middle School, and Montwood High School.
Ownership History
Date
Name
Owned For
Owner Type
Purchase Details
Closed on
Jul 14, 2006
Sold by
Mascorro Victor and Sanchez Mary Grace
Bought by
Holguin Efren and Holguin Yolanda
Current Estimated Value
Home Financials for this Owner
Home Financials are based on the most recent Mortgage that was taken out on this home.
Original Mortgage
$20,000
Outstanding Balance
$11,854
Interest Rate
6.62%
Mortgage Type
Unknown
Estimated Equity
$154,391
Purchase Details
Closed on
Sep 30, 1999
Sold by
Acquisition Ept Ltd
Bought by
Mascorro Victor and Sanchez Mary Grace
Home Financials for this Owner
Home Financials are based on the most recent Mortgage that was taken out on this home.
Original Mortgage
$57,413
Interest Rate
7.83%
Mortgage Type
FHA
Purchase Details
Closed on
Dec 1, 1998
Sold by
Maldonado Antonio and Maldonado Gloria A
Bought by
Acquisition Ept Ltd
Create a Home Valuation Report for This Property
The Home Valuation Report is an in-depth analysis detailing your home's value as well as a comparison with similar homes in the area
Home Values in the Area
Average Home Value in this Area
Purchase History
| Date | Buyer | Sale Price | Title Company |
|---|---|---|---|
| Holguin Efren | -- | None Available | |
| Mascorro Victor | -- | -- | |
| Acquisition Ept Ltd | $36,000 | -- |
Source: Public Records
Mortgage History
| Date | Status | Borrower | Loan Amount |
|---|---|---|---|
| Open | Holguin Efren | $20,000 | |
| Open | Holguin Efren | $64,900 | |
| Previous Owner | Mascorro Victor | $57,413 |
Source: Public Records
Tax History Compared to Growth
Tax History
| Year | Tax Paid | Tax Assessment Tax Assessment Total Assessment is a certain percentage of the fair market value that is determined by local assessors to be the total taxable value of land and additions on the property. | Land | Improvement |
|---|---|---|---|---|
| 2025 | $2,340 | $146,814 | $20,573 | $126,241 |
| 2024 | $2,340 | $134,341 | -- | -- |
| 2023 | $2,202 | $122,128 | $0 | $0 |
| 2022 | $3,215 | $111,025 | $0 | $0 |
| 2021 | $3,177 | $105,268 | $20,573 | $84,695 |
| 2020 | $2,912 | $91,756 | $16,611 | $75,145 |
| 2018 | $2,713 | $92,753 | $16,611 | $76,142 |
| 2017 | $2,458 | $86,049 | $16,611 | $69,438 |
| 2016 | $2,458 | $86,049 | $16,611 | $69,438 |
| 2015 | $2,126 | $86,049 | $16,611 | $69,438 |
| 2014 | $2,126 | $85,550 | $16,611 | $68,939 |
Source: Public Records
Map
Nearby Homes
- 3655 George Dieter Dr
- 1700 Jerry Abbott St
- 1739 Jerry Abbott St
- 1733 Karl Wyler Dr
- 1804 Jerry Abbott St
- 1703 Robert Wynn St
- 11506 James Grant Dr
- 1639 Brian Ray Cir
- 1607 Tommy Aaron Dr
- 11204 Bob Mitchell Dr
- 11470 Ed Merrins Dr
- 1935 Bay City Place
- 11268 Enid Wilson Ln
- 1617 Tommy Aaron Dr
- 11262 Enid Wilson Ln
- 11452 Jim Ferriell Dr
- 11539 Clear Lake Way
- 11663 Clear Lake Way
- 11531 Meadowbrook Dr
- 1690 Leroy Bonse Dr
- 11413 Jack Cupit Ln
- 11405 Jack Cupit Ln
- 11408 Bunky Henry Ln
- 11412 Bunky Henry Ln
- 11417 Jack Cupit Ln
- 11404 Bunky Henry Ln
- 11401 Jack Cupit Ln
- 11416 Bunky Henry Ln
- 11416 Bunky Henry Ln Unit 1
- 11400 Bunky Henry Ln
- 11404 Jack Cupit Ln
- 11414 Jack Cupit Ln
- 11421 Jack Cupit Ln
- 11400 Jack Cupit Ln
- 11420 Bunky Henry Ln
- 11418 Jack Cupit Ln
- 11424 Bunky Henry Ln
- 11405 Bob Mitchell Dr
- 11425 Jack Cupit Ln
- 11409 Bunky Henry Ln