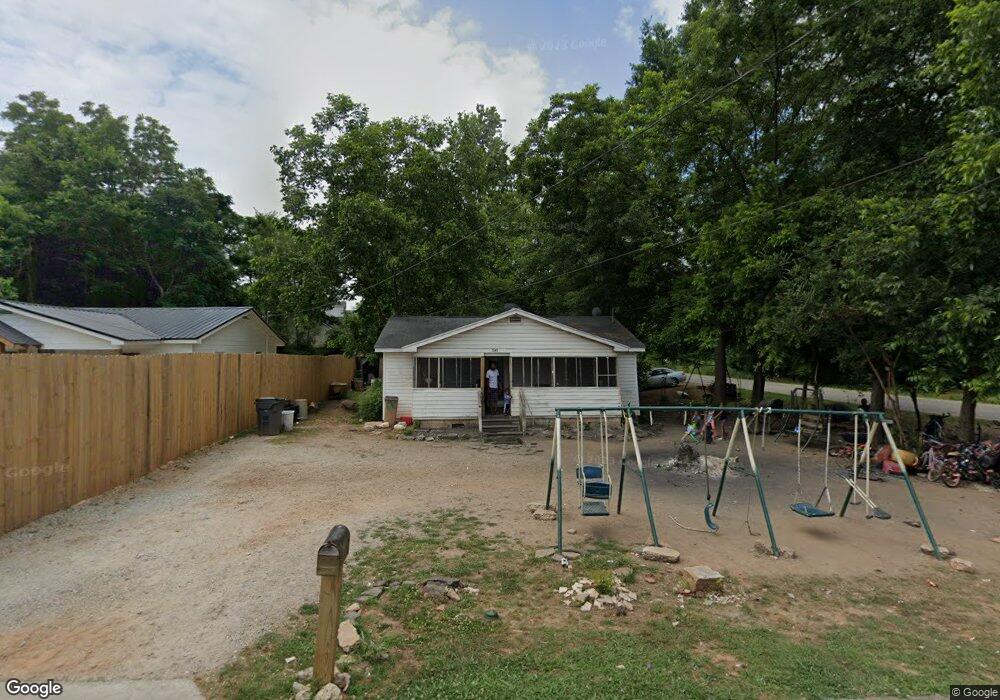
1141 Apalachee Ave Greensboro, GA 30642
Estimated Value: $47,186 - $243,000
2
Beds
1
Bath
780
Sq Ft
$212/Sq Ft
Est. Value
About This Home
This home is located at 1141 Apalachee Ave, Greensboro, GA 30642 and is currently estimated at $165,297, approximately $211 per square foot. 1141 Apalachee Ave is a home located in Greene County with nearby schools including Greene County High School.
Ownership History
Date
Name
Owned For
Owner Type
Purchase Details
Closed on
Jan 28, 2022
Sold by
Casteel Darrell
Bought by
Ash Monica
Current Estimated Value
Purchase Details
Closed on
Jan 13, 2019
Sold by
Mcclure Elizabeth Ann
Bought by
Casteel Darrell
Purchase Details
Closed on
Jun 10, 2011
Sold by
Casteel Darrell Preston
Bought by
Mcclure Elizabeth Ann
Purchase Details
Closed on
Aug 31, 2005
Sold by
Green Tree Servicing Llc
Bought by
Castell Darrell
Purchase Details
Closed on
Jan 3, 2005
Sold by
Webb Grace
Bought by
Green Tree Servicing Llc
Purchase Details
Closed on
Mar 23, 2000
Sold by
Webb Grace
Bought by
Webb Grace
Purchase Details
Closed on
Oct 5, 1994
Sold by
Dunn Idonia B and John Ores
Bought by
Webb Grace
Purchase Details
Closed on
May 29, 1994
Sold by
Dunn Idonia B and John Ores,
Bought by
Dunn Idonia B and John Ores
Purchase Details
Closed on
Jan 1, 1989
Sold by
Dunn John and Dunn Idonia
Bought by
Dunn Idonia B and John Ores,
Purchase Details
Closed on
Jan 1, 1965
Bought by
Dunn John and Dunn Idonia
Create a Home Valuation Report for This Property
The Home Valuation Report is an in-depth analysis detailing your home's value as well as a comparison with similar homes in the area
Home Values in the Area
Average Home Value in this Area
Purchase History
| Date | Buyer | Sale Price | Title Company |
|---|---|---|---|
| Ash Monica | $18,000 | -- | |
| Casteel Darrell | $14,400 | -- | |
| Mcclure Elizabeth Ann | $7,500 | -- | |
| Castell Darrell | $20,000 | -- | |
| Green Tree Servicing Llc | -- | -- | |
| Webb Grace | -- | -- | |
| Webb Grace | $23,000 | -- | |
| Dunn Idonia B | -- | -- | |
| Dunn Idonia B | -- | -- | |
| Dunn John | -- | -- |
Source: Public Records
Tax History Compared to Growth
Tax History
| Year | Tax Paid | Tax Assessment Tax Assessment Total Assessment is a certain percentage of the fair market value that is determined by local assessors to be the total taxable value of land and additions on the property. | Land | Improvement |
|---|---|---|---|---|
| 2024 | $470 | $10,680 | $2,920 | $7,760 |
| 2023 | $350 | $10,120 | $2,920 | $7,200 |
| 2022 | $371 | $11,280 | $3,680 | $7,600 |
| 2021 | $361 | $10,480 | $3,680 | $6,800 |
| 2020 | $282 | $5,760 | $2,120 | $3,640 |
| 2019 | $286 | $5,760 | $2,120 | $3,640 |
| 2018 | $264 | $5,760 | $2,120 | $3,640 |
| 2017 | $256 | $5,788 | $2,125 | $3,663 |
| 2016 | $256 | $5,788 | $2,125 | $3,663 |
| 2015 | $228 | $5,788 | $2,125 | $3,663 |
| 2014 | $225 | $5,504 | $2,125 | $3,379 |
Source: Public Records
Map
Nearby Homes
- 1061 Grimes St
- 314 W South St
- 0 Maple Cir
- 208 W South St
- 15 South St Unit Siloam Road
- 805 S West St
- 301 N East St
- 504 Martin Luther King Junior Dr
- 0 Canaan St
- 105 Wilson St
- 109 Reynolds Dr
- 1020 Horton Dr
- 0 Railroad St Unit 218854
- 0 Railroad St Unit 10578007
- 0 Railroad St Unit 531919
- Lots 9-11 Town Creek Blvd
- Lot 8 Town Creek Blvd
- Lot 7 Town Creek Blvd
- Lot 6 Town Creek Blvd
- Lot 5 Town Creek Blvd
- 1151 Apalachee Ave
- 1091 Grimes St
- 1090 Grimes St
- 1170 Apalachee Ave
- 1081 Grimes St
- 1181 Apalachee Ave
- 1060 Charity Dr
- 1180 Apalachee Ave
- 1071 Grimes St Unit 7
- 1071 Grimes St
- 1071 Grimes St Unit Oconee Springs
- 0 Grimes St Unit 7277879
- 0 Grimes St Unit 8278747
- 0 Grimes St Unit 8260273
- 0 Grimes St Unit 8080089
- 0 Grimes St Unit 8977579
- 0 Grimes St Unit 3223876
- 1191 Apalachee Ave
- 1190 Apalachee Ave
- 1050 Charity Dr