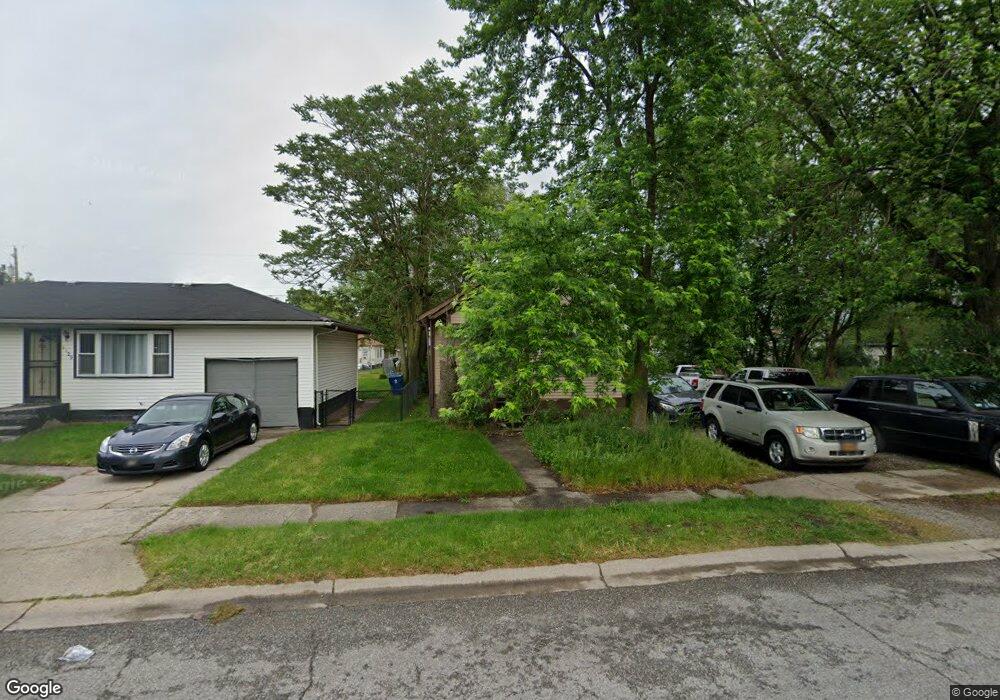
1141 Burr St Gary, IN 46406
Westside NeighborhoodEstimated Value: $72,026 - $90,000
2
Beds
1
Bath
756
Sq Ft
$109/Sq Ft
Est. Value
About This Home
This home is located at 1141 Burr St, Gary, IN 46406 and is currently estimated at $82,507, approximately $109 per square foot. 1141 Burr St is a home located in Lake County with nearby schools including Bailly Preparatory Academy, West Side Leadership Academy, and Aspire Charter Academy.
Ownership History
Date
Name
Owned For
Owner Type
Purchase Details
Closed on
Sep 8, 2021
Sold by
Doug Parrett Blue Print Investments
Bought by
West Carl
Current Estimated Value
Purchase Details
Closed on
Oct 15, 2012
Sold by
Gonzalez Cassandra A
Bought by
Dourg Parrett Blue Print Investment Inc
Purchase Details
Closed on
Nov 1, 2011
Sold by
Gonzalez Cassandra
Bought by
Parrett Doug and Blue Print Investments Inc
Purchase Details
Closed on
Jun 19, 2009
Sold by
Cavender Properties Llc
Bought by
Gonzalez Cassandra A
Purchase Details
Closed on
Jun 16, 2009
Sold by
Secretary Of Housing & Urban Development
Bought by
Cavender Properties Llc
Purchase Details
Closed on
May 14, 2008
Sold by
Gmac Mortgage Llc
Bought by
Hud
Purchase Details
Closed on
Apr 4, 2008
Sold by
Groce Noel D
Bought by
Gmac Mortgage Llc
Create a Home Valuation Report for This Property
The Home Valuation Report is an in-depth analysis detailing your home's value as well as a comparison with similar homes in the area
Home Values in the Area
Average Home Value in this Area
Purchase History
| Date | Buyer | Sale Price | Title Company |
|---|---|---|---|
| West Carl | -- | None Listed On Document | |
| Dourg Parrett Blue Print Investment Inc | -- | None Available | |
| Parrett Doug | -- | None Available | |
| Gonzalez Cassandra A | -- | Meridian Title Corp | |
| Cavender Properties Llc | -- | Meridian Title Corp | |
| Hud | -- | None Available | |
| Gmac Mortgage Llc | $53,312 | None Available |
Source: Public Records
Tax History Compared to Growth
Tax History
| Year | Tax Paid | Tax Assessment Tax Assessment Total Assessment is a certain percentage of the fair market value that is determined by local assessors to be the total taxable value of land and additions on the property. | Land | Improvement |
|---|---|---|---|---|
| 2024 | $4,470 | $54,700 | $9,700 | $45,000 |
| 2023 | $1,181 | $50,700 | $9,700 | $41,000 |
| 2022 | $1,181 | $46,100 | $6,500 | $39,600 |
| 2021 | $1,097 | $42,800 | $6,500 | $36,300 |
| 2020 | $1,056 | $41,200 | $6,500 | $34,700 |
| 2019 | $989 | $41,200 | $6,500 | $34,700 |
| 2018 | $967 | $41,200 | $6,500 | $34,700 |
| 2017 | $961 | $41,700 | $6,500 | $35,200 |
| 2016 | $985 | $43,400 | $6,500 | $36,900 |
| 2014 | $1,037 | $44,300 | $7,400 | $36,900 |
| 2013 | $964 | $42,900 | $7,400 | $35,500 |
Source: Public Records
Map
Nearby Homes
- 1124 Clinton St
- 1047 Ralston St
- 1035 Clinton St
- 982 Ralston St
- 1045 - 1051 Durbin St
- 1395 Ralston St
- 1528 Hanley St
- 1152 Hovey St
- 1529 Hovey St
- 349 Hamlin St
- 735 Burr St
- 730 Matthews St
- 621 Burr St
- 4408 W 10th Ave
- 1831 Burr St
- 1564 Baker St
- 968 Baker St
- 4838 W 6th Ave
- 846 Stevenson St
- 945 - 949 Clark Rd