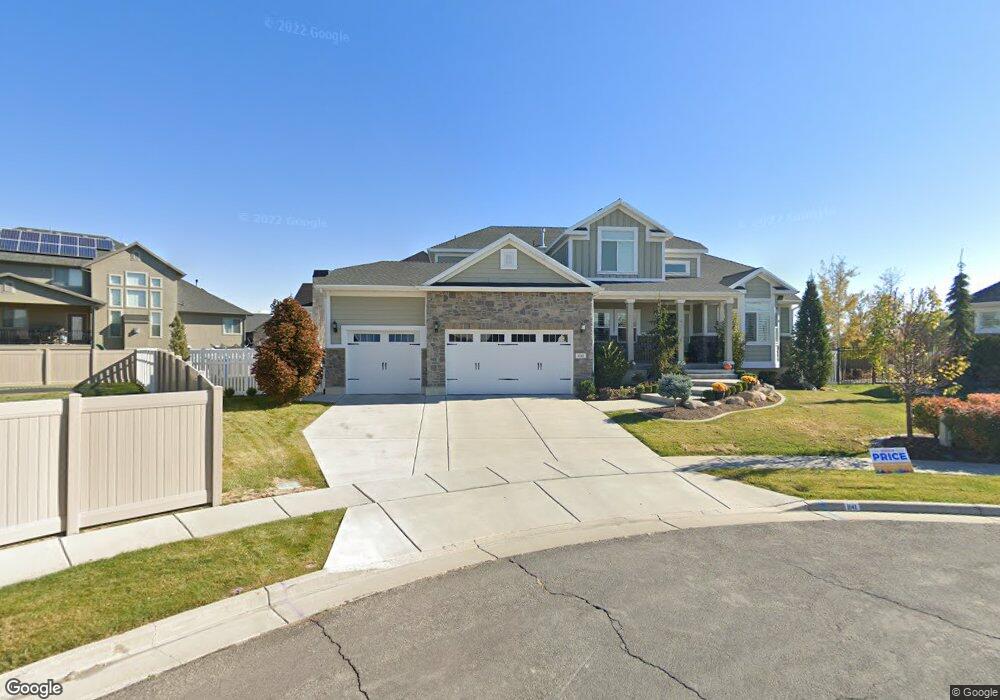
1141 Durness Cir Syracuse, UT 84075
Estimated Value: $749,498 - $803,000
3
Beds
3
Baths
3,998
Sq Ft
$195/Sq Ft
Est. Value
About This Home
This home is located at 1141 Durness Cir, Syracuse, UT 84075 and is currently estimated at $780,375, approximately $195 per square foot. 1141 Durness Cir is a home located in Davis County with nearby schools including Buffalo Point School, Syracuse Junior High School, and Syracuse High School.
Ownership History
Date
Name
Owned For
Owner Type
Purchase Details
Closed on
Feb 1, 2021
Sold by
Robbins Douglas S and Robbins Traci L
Bought by
Robbins Traci L and Robbins Douglas S
Current Estimated Value
Home Financials for this Owner
Home Financials are based on the most recent Mortgage that was taken out on this home.
Original Mortgage
$366,830
Outstanding Balance
$263,833
Interest Rate
2.6%
Mortgage Type
New Conventional
Estimated Equity
$516,542
Purchase Details
Closed on
Oct 29, 2012
Sold by
Ivory Homes Ltd
Bought by
Robbins Douglas S and Robbins Traci L
Home Financials for this Owner
Home Financials are based on the most recent Mortgage that was taken out on this home.
Original Mortgage
$396,150
Interest Rate
3.43%
Mortgage Type
New Conventional
Purchase Details
Closed on
Oct 26, 2011
Sold by
Blackburn Jones Real Estate Inc
Bought by
Ivory Homes Ltd
Create a Home Valuation Report for This Property
The Home Valuation Report is an in-depth analysis detailing your home's value as well as a comparison with similar homes in the area
Home Values in the Area
Average Home Value in this Area
Purchase History
| Date | Buyer | Sale Price | Title Company |
|---|---|---|---|
| Robbins Traci L | -- | First American Ti | |
| Robbins Douglas S | -- | Cottonwood Title Ins Agency | |
| Ivory Homes Ltd | -- | Backman Title Servic |
Source: Public Records
Mortgage History
| Date | Status | Borrower | Loan Amount |
|---|---|---|---|
| Open | Robbins Traci L | $366,830 | |
| Closed | Robbins Douglas S | $396,150 |
Source: Public Records
Tax History
| Year | Tax Paid | Tax Assessment Tax Assessment Total Assessment is a certain percentage of the fair market value that is determined by local assessors to be the total taxable value of land and additions on the property. | Land | Improvement |
|---|---|---|---|---|
| 2025 | $4,059 | $391,600 | $118,570 | $273,030 |
| 2024 | $4,003 | $388,850 | $97,898 | $290,952 |
| 2023 | $3,769 | $667,000 | $145,126 | $521,874 |
| 2022 | $4,002 | $388,300 | $74,516 | $313,784 |
| 2021 | $3,615 | $543,000 | $108,411 | $434,589 |
| 2020 | $3,218 | $468,000 | $89,421 | $378,579 |
| 2019 | $3,232 | $464,000 | $92,395 | $371,605 |
| 2018 | $3,018 | $430,000 | $89,242 | $340,758 |
| 2016 | $3,047 | $227,700 | $36,403 | $191,297 |
| 2015 | $2,969 | $211,310 | $36,403 | $174,907 |
| 2014 | $2,696 | $195,554 | $36,403 | $159,151 |
| 2013 | -- | $227,415 | $34,625 | $192,790 |
Source: Public Records
Map
Nearby Homes
- 3546 Brookshire Dr
- 1430 Heather Ln
- 3736 W 1225 S
- 3867 Rungsted Cir
- 3971 W 975 S
- 4068 W 1200 S
- 536 S Thurgood Ln
- 1829 S 3525 W
- 1340 S 4125 W
- 2885 W 700 S
- 1007 S 4200 W
- 4193 W 1175 S
- 2982 S 3000 W
- 2912 S 3000 W
- 1157 S 4425 W
- 4411 W 920 S Unit 111
- 1302 S 4350 W
- 1139 S 4475 W
- 1155 S 4475 W
- 2679 W Antelope Dr
- 1141 Durness Cir
- 1147 Durness Cir
- 1148 Gullane Cir
- 3457 Augusta Dr
- 1138 Gullane Cir
- 1128 Gullane Cir
- 1157 Gullane Cir
- 3513 Augusta Dr
- 1149 Gullane Cir
- 1139 Gullane Cir
- 1107 Loch Lomond Cir
- 3525 Augusta Dr
- 1127 Gullane Cir
- 1102 Loch Lomond Cir
- 3494 Inverness Dr
- 1154 St Andrews Dr Unit 602
- 3541 Augusta Dr Unit 310
- 1091 Loch Lomond Cir
- 1166 Saint Andrews Dr
- 1138 St Andrews Dr Unit 603
Your Personal Tour Guide
Ask me questions while you tour the home.