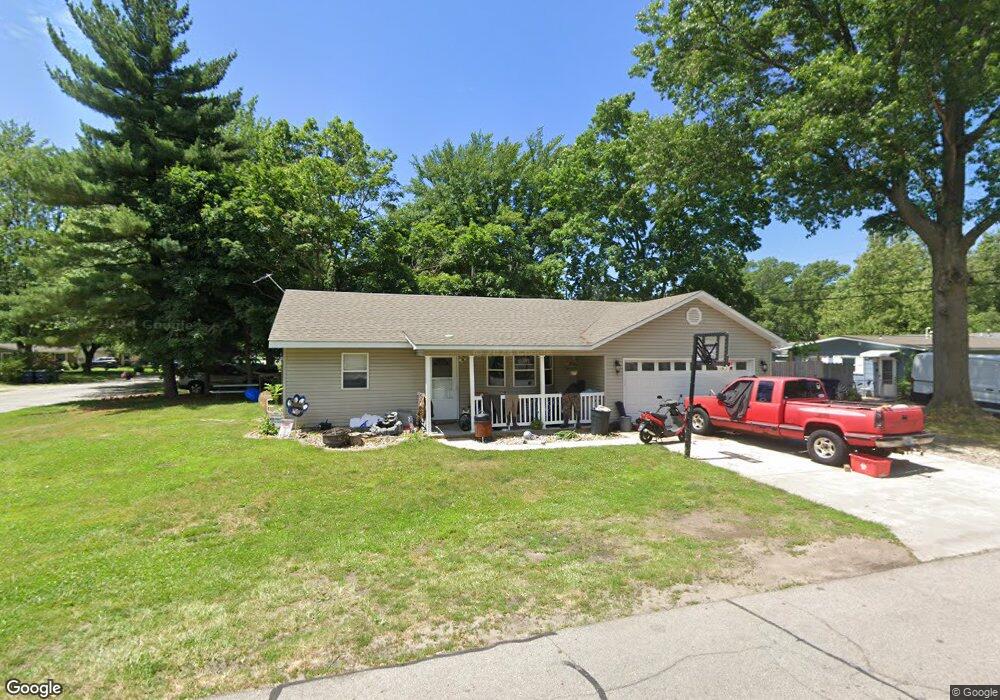
1141 Hoyt St Michigan City, IN 46360
Estimated Value: $155,000 - $275,000
2
Beds
1
Bath
750
Sq Ft
$263/Sq Ft
Est. Value
About This Home
This home is located at 1141 Hoyt St, Michigan City, IN 46360 and is currently estimated at $197,329, approximately $263 per square foot. 1141 Hoyt St is a home located in LaPorte County with nearby schools including Knapp Elementary School, Barker Middle School, and Michigan City High School.
Ownership History
Date
Name
Owned For
Owner Type
Purchase Details
Closed on
Mar 17, 2008
Sold by
U S Bank Na
Bought by
Manley Derrick A
Current Estimated Value
Home Financials for this Owner
Home Financials are based on the most recent Mortgage that was taken out on this home.
Original Mortgage
$36,575
Interest Rate
5.88%
Mortgage Type
Unknown
Purchase Details
Closed on
Nov 20, 2007
Sold by
Gushrowski Phillip L and Johnston Garry A
Bought by
U S Bank Na and Asset Backed Pass Through Certificates S
Create a Home Valuation Report for This Property
The Home Valuation Report is an in-depth analysis detailing your home's value as well as a comparison with similar homes in the area
Home Values in the Area
Average Home Value in this Area
Purchase History
| Date | Buyer | Sale Price | Title Company |
|---|---|---|---|
| Manley Derrick A | -- | Statewide Title | |
| U S Bank Na | $47,000 | Statewide Title Co Inc |
Source: Public Records
Mortgage History
| Date | Status | Borrower | Loan Amount |
|---|---|---|---|
| Previous Owner | Manley Derrick A | $36,575 |
Source: Public Records
Tax History Compared to Growth
Tax History
| Year | Tax Paid | Tax Assessment Tax Assessment Total Assessment is a certain percentage of the fair market value that is determined by local assessors to be the total taxable value of land and additions on the property. | Land | Improvement |
|---|---|---|---|---|
| 2024 | $1,274 | $142,500 | $22,300 | $120,200 |
| 2023 | $1,202 | $120,200 | $22,300 | $97,900 |
| 2022 | $1,158 | $115,800 | $22,300 | $93,500 |
| 2021 | $1,025 | $102,500 | $22,300 | $80,200 |
| 2020 | $645 | $102,500 | $22,300 | $80,200 |
| 2019 | $639 | $72,900 | $19,300 | $53,600 |
| 2018 | $584 | $64,200 | $13,000 | $51,200 |
| 2017 | $558 | $61,900 | $13,000 | $48,900 |
| 2016 | $1,232 | $59,200 | $10,900 | $48,300 |
| 2014 | $1,154 | $57,700 | $10,900 | $46,800 |
Source: Public Records
Map
Nearby Homes