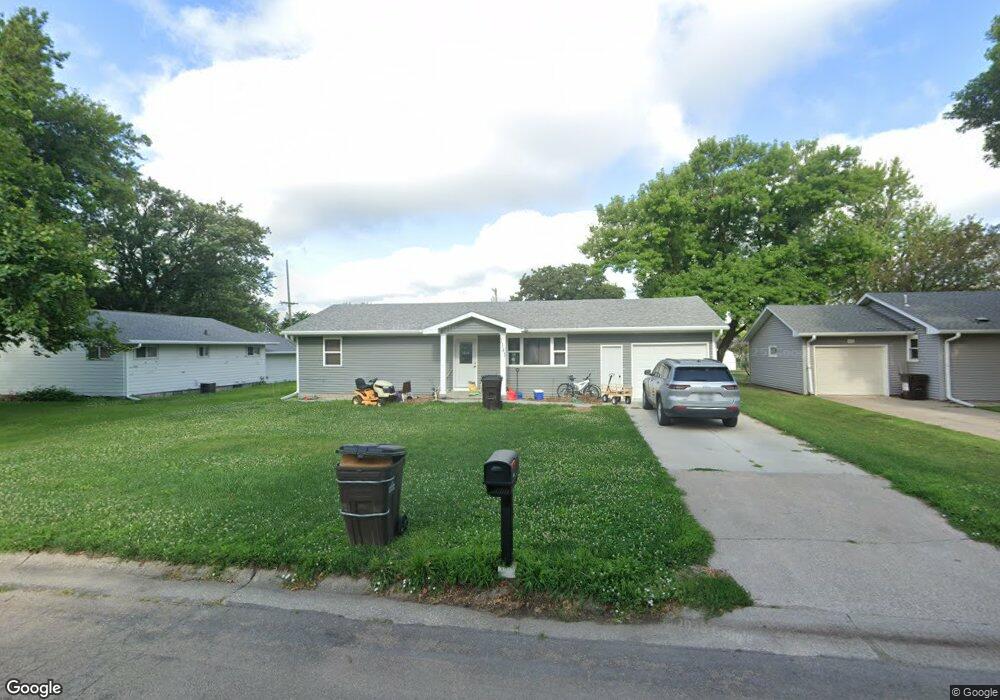
1141 N 8th St David City, NE 68632
Estimated Value: $226,302 - $276,000
2
Beds
1
Bath
1,092
Sq Ft
$225/Sq Ft
Est. Value
About This Home
This home is located at 1141 N 8th St, David City, NE 68632 and is currently estimated at $245,826, approximately $225 per square foot. 1141 N 8th St is a home located in Butler County with nearby schools including David City Secondary School, St. Mary's School, and Aquinas High School.
Ownership History
Date
Name
Owned For
Owner Type
Purchase Details
Closed on
Apr 30, 2021
Sold by
Osborn Douglas M and Osborn Jeanne
Bought by
Thies Matthew and Thies Tracy
Current Estimated Value
Home Financials for this Owner
Home Financials are based on the most recent Mortgage that was taken out on this home.
Original Mortgage
$212,121
Outstanding Balance
$192,235
Interest Rate
3.1%
Mortgage Type
New Conventional
Estimated Equity
$53,591
Purchase Details
Closed on
Mar 10, 2020
Sold by
Sedlacek Earl L
Bought by
Osborn Douglas M and Osborn Jeanne
Create a Home Valuation Report for This Property
The Home Valuation Report is an in-depth analysis detailing your home's value as well as a comparison with similar homes in the area
Home Values in the Area
Average Home Value in this Area
Purchase History
| Date | Buyer | Sale Price | Title Company |
|---|---|---|---|
| Thies Matthew | $210,000 | None Available | |
| Tries Matthew | $210,000 | None Listed On Document | |
| Osborn Douglas M | $60,000 | None Available |
Source: Public Records
Mortgage History
| Date | Status | Borrower | Loan Amount |
|---|---|---|---|
| Open | Thies Matthew | $212,121 |
Source: Public Records
Tax History Compared to Growth
Tax History
| Year | Tax Paid | Tax Assessment Tax Assessment Total Assessment is a certain percentage of the fair market value that is determined by local assessors to be the total taxable value of land and additions on the property. | Land | Improvement |
|---|---|---|---|---|
| 2024 | $2,522 | $210,055 | $16,660 | $193,395 |
| 2023 | $2,898 | $193,940 | $16,660 | $177,280 |
| 2022 | $2,479 | $161,225 | $16,660 | $144,565 |
| 2021 | $1,688 | $109,650 | $9,800 | $99,850 |
| 2020 | $756 | $48,205 | $9,800 | $38,405 |
| 2019 | $627 | $40,140 | $9,800 | $30,340 |
| 2018 | $640 | $41,620 | $9,800 | $31,820 |
| 2017 | $647 | $42,140 | $9,800 | $32,340 |
| 2016 | $609 | $40,435 | $9,800 | $30,635 |
| 2015 | $664 | $41,250 | $9,800 | $31,450 |
| 2014 | $708 | $42,450 | $9,800 | $32,650 |
Source: Public Records
Map
Nearby Homes