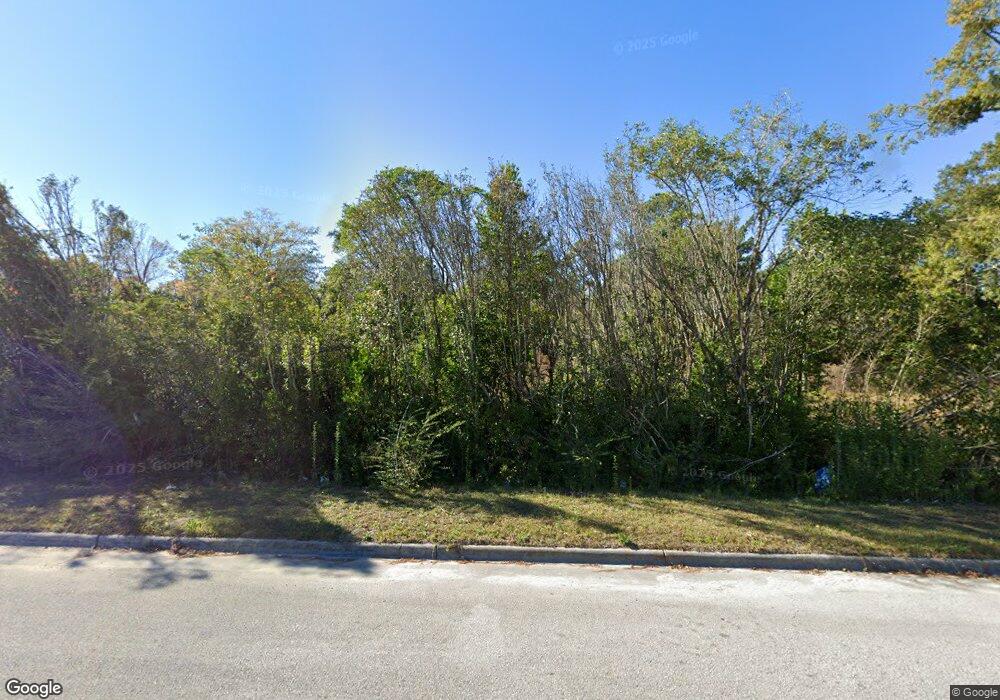
1141 N Kerr Ave Wilmington, NC 28405
Old East Wilmington NeighborhoodEstimated Value: $225,000
3
Beds
2
Baths
1,721
Sq Ft
$131/Sq Ft
Est. Value
About This Home
This home is located at 1141 N Kerr Ave, Wilmington, NC 28405 and is currently priced at $225,000, approximately $130 per square foot. 1141 N Kerr Ave is a home located in New Hanover County with nearby schools including Wrightsboro Elementary School, Holly Shelter Middle School, and Emsley A. Laney High School.
Ownership History
Date
Name
Owned For
Owner Type
Purchase Details
Closed on
Jun 24, 2019
Sold by
Rollinson Burnis C
Bought by
Department Of Transportation
Current Estimated Value
Purchase Details
Closed on
Jul 18, 2017
Sold by
Lynch Fredrick T and Lynch Paulette F
Bought by
Rollinson Burnis C
Home Financials for this Owner
Home Financials are based on the most recent Mortgage that was taken out on this home.
Original Mortgage
$137,464
Interest Rate
4.4%
Mortgage Type
FHA
Purchase Details
Closed on
Oct 6, 1995
Sold by
Lynch Fredrick T Paulette F
Bought by
Nc Dept Of Transportation
Purchase Details
Closed on
Jul 1, 1993
Sold by
Forester Anthony J Nancy
Bought by
Lynch Fredrick T Paulette F
Purchase Details
Closed on
Jun 1, 1987
Sold by
Johnston Willie Sue
Bought by
Forester Anthony J Nancy
Purchase Details
Closed on
Mar 1, 1956
Bought by
Johnston Willie Sue
Create a Home Valuation Report for This Property
The Home Valuation Report is an in-depth analysis detailing your home's value as well as a comparison with similar homes in the area
Home Values in the Area
Average Home Value in this Area
Purchase History
| Date | Buyer | Sale Price | Title Company |
|---|---|---|---|
| Department Of Transportation | $550 | None Available | |
| Rollinson Burnis C | $140,000 | None Available | |
| Nc Dept Of Transportation | $2,500 | -- | |
| Lynch Fredrick T Paulette F | $87,000 | -- | |
| Forester Anthony J Nancy | $72,500 | -- | |
| Johnston Willie Sue | -- | -- |
Source: Public Records
Mortgage History
| Date | Status | Borrower | Loan Amount |
|---|---|---|---|
| Previous Owner | Rollinson Burnis C | $137,464 |
Source: Public Records
Tax History Compared to Growth
Tax History
| Year | Tax Paid | Tax Assessment Tax Assessment Total Assessment is a certain percentage of the fair market value that is determined by local assessors to be the total taxable value of land and additions on the property. | Land | Improvement |
|---|---|---|---|---|
| 2021 | $0 | $51,200 | $51,200 | $0 |
| 2020 | $862 | $81,800 | $44,200 | $37,600 |
| 2019 | $0 | $81,800 | $44,200 | $37,600 |
| 2018 | $862 | $81,800 | $44,200 | $37,600 |
| 2017 | $862 | $81,800 | $44,200 | $37,600 |
| 2016 | $480 | $43,300 | $4,200 | $39,100 |
| 2015 | -- | $57,900 | $11,600 | $46,300 |
| 2014 | $638 | $125,800 | $40,400 | $85,400 |
Source: Public Records
Map
Nearby Homes
- 4519 Sagedale Dr Unit 203
- 4140 Lockwood Dr
- 1013 Glenlea Dr
- 4217 Sunglow Dr
- 700 Indica Ct Unit 302
- 620 Tabor Ln
- 719 Grathwol Dr
- 4213 Fairlawn Dr
- 4516 Crawdad Ct
- 4628 Crawdad Ct
- 5006 Hunters Trail Unit 2
- 4609 Mcclelland Dr Unit 104-D
- 4629 Mcclelland Dr Unit T201
- 4615 Mcclelland Dr Unit G202
- 4615 Mcclelland Dr Unit G203
- 4611 Mcclelland Dr Unit E102
- 607 Sharease Cir
- 710 Cheryl Ln
- 409 Saint Rosea Rd
- 4427 Deborah Ct
- 1149 N Kerr Ave
- 1131 N Kerr Ave
- 1125 N Kerr Ave
- 1155 N Kerr Ave
- 1150 N Kerr Ave
- 1156 N Kerr Ave
- 1159 N Kerr Ave
- 1134 N Kerr Ave
- 1163 N Kerr Ave
- 4008 Alandale Dr
- 1026 N Kerr Ave
- 4500 Greentree Rd
- 1205 N Kerr Ave
- 4014 Alandale Dr
- 4502 Greentree Rd
- 1202 N Kerr Ave
- 4018 Alandale Dr
- 4009 Alandale
- 4516 Greentree Rd Unit 8
- 4516 Greentree Rd