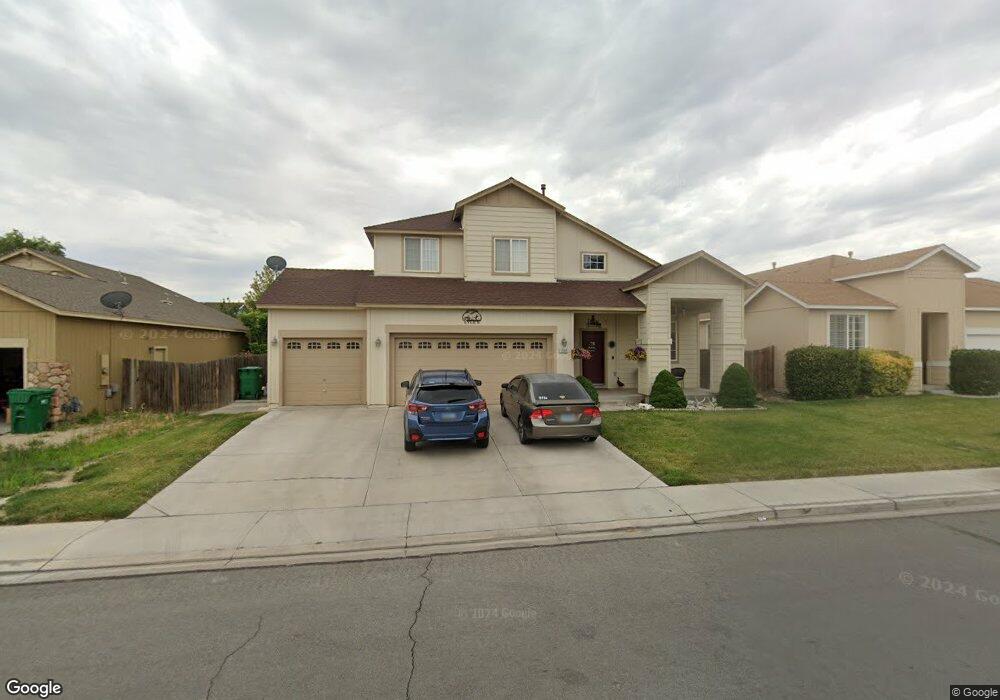
1141 Shadow Ln Fernley, NV 89408
Estimated Value: $409,000 - $433,000
3
Beds
3
Baths
2,159
Sq Ft
$195/Sq Ft
Est. Value
About This Home
This home is located at 1141 Shadow Ln, Fernley, NV 89408 and is currently estimated at $421,462, approximately $195 per square foot. 1141 Shadow Ln is a home located in Lyon County with nearby schools including Cottonwood Elementary School, Fernley Intermediate School, and Fernley High School.
Ownership History
Date
Name
Owned For
Owner Type
Purchase Details
Closed on
May 19, 2020
Sold by
Lyle Travis L and Lyle Travis L
Bought by
Lyle Travis L and Lyle Temple A
Current Estimated Value
Home Financials for this Owner
Home Financials are based on the most recent Mortgage that was taken out on this home.
Original Mortgage
$176,450
Outstanding Balance
$123,423
Interest Rate
3.3%
Mortgage Type
New Conventional
Estimated Equity
$298,039
Purchase Details
Closed on
Aug 30, 2005
Sold by
Fernlley Sundace Llc
Bought by
Lyle Travis L
Home Financials for this Owner
Home Financials are based on the most recent Mortgage that was taken out on this home.
Original Mortgage
$218,712
Interest Rate
6.37%
Mortgage Type
Adjustable Rate Mortgage/ARM
Purchase Details
Closed on
Aug 29, 2005
Sold by
Lyle Temple A
Bought by
Lyle Travis L
Home Financials for this Owner
Home Financials are based on the most recent Mortgage that was taken out on this home.
Original Mortgage
$218,712
Interest Rate
6.37%
Mortgage Type
Adjustable Rate Mortgage/ARM
Create a Home Valuation Report for This Property
The Home Valuation Report is an in-depth analysis detailing your home's value as well as a comparison with similar homes in the area
Home Values in the Area
Average Home Value in this Area
Purchase History
| Date | Buyer | Sale Price | Title Company |
|---|---|---|---|
| Lyle Travis L | -- | Western Title Company | |
| Lyle Travis L | $273,396 | Western Title Company Inc | |
| Lyle Travis L | -- | Western Title Company Inc |
Source: Public Records
Mortgage History
| Date | Status | Borrower | Loan Amount |
|---|---|---|---|
| Open | Lyle Travis L | $176,450 | |
| Closed | Lyle Travis L | $218,712 | |
| Closed | Lyle Travis L | $47,678 |
Source: Public Records
Tax History Compared to Growth
Tax History
| Year | Tax Paid | Tax Assessment Tax Assessment Total Assessment is a certain percentage of the fair market value that is determined by local assessors to be the total taxable value of land and additions on the property. | Land | Improvement |
|---|---|---|---|---|
| 2025 | $1,926 | $118,283 | $36,750 | $81,533 |
| 2024 | $2,279 | $118,738 | $36,750 | $81,987 |
| 2023 | $2,279 | $120,560 | $43,750 | $76,810 |
| 2022 | $2,141 | $114,600 | $43,750 | $70,850 |
| 2021 | $2,115 | $98,810 | $29,750 | $69,060 |
| 2020 | $2,061 | $95,739 | $29,750 | $65,989 |
| 2019 | $2,029 | $89,790 | $26,250 | $63,540 |
| 2018 | $1,985 | $80,232 | $18,200 | $62,032 |
| 2017 | $1,972 | $73,372 | $11,380 | $61,992 |
| 2016 | $1,777 | $58,137 | $5,780 | $52,357 |
| 2015 | $1,812 | $45,088 | $5,780 | $39,308 |
| 2014 | $1,770 | $38,066 | $5,780 | $32,286 |
Source: Public Records
Map
Nearby Homes
- 1224 Mountain Rose Dr
- 465 Jennys Ln
- 1411 Shadow Ln
- 955 Aster Ln
- 350 Randon Ct
- 70 Middleton Way
- 965 Aster Ln
- 77 Middleton Way
- 80 Middleton Way
- 95 Middleton Way
- 736 Shadow Ln
- 875 Villa Way
- 1165 Farm Ln
- 332 Wildrose Dr
- 331 Wildrose Dr
- 1494 Mountain Rose Dr
- 698 Jenny's Ln
- 125 Farmington Way
- 2605 Emerson Cir
- 1505 Wrangler Ln
- 1131 Shadow Ln
- 1151 Shadow Ln
- 1144 Mountain Rose Dr
- 1154 Mountain Rose Dr
- 1164 Mountain Rose Dr
- 1164 Mountain Rose Dr Unit NV
- 1161 Shadow Ln
- 1134 Mountain Rose Dr
- 561 Sunrise Ln
- 1130 Shadow Ln
- 1140 Shadow Ln
- 563 Sunrise Ln
- 1174 Mountain Rose Dr
- 1171 Shadow Ln
- 1120 Shadow Ln
- 1124 Mountain Rose Dr
- 1160 Shadow Ln
- 545 Sunrise Cir
- 1184 Mountain Rose Dr
- 560 Stone Creek Ct