Estimated Value: $232,000 - $326,000
3
Beds
2
Baths
1,700
Sq Ft
$158/Sq Ft
Est. Value
About This Home
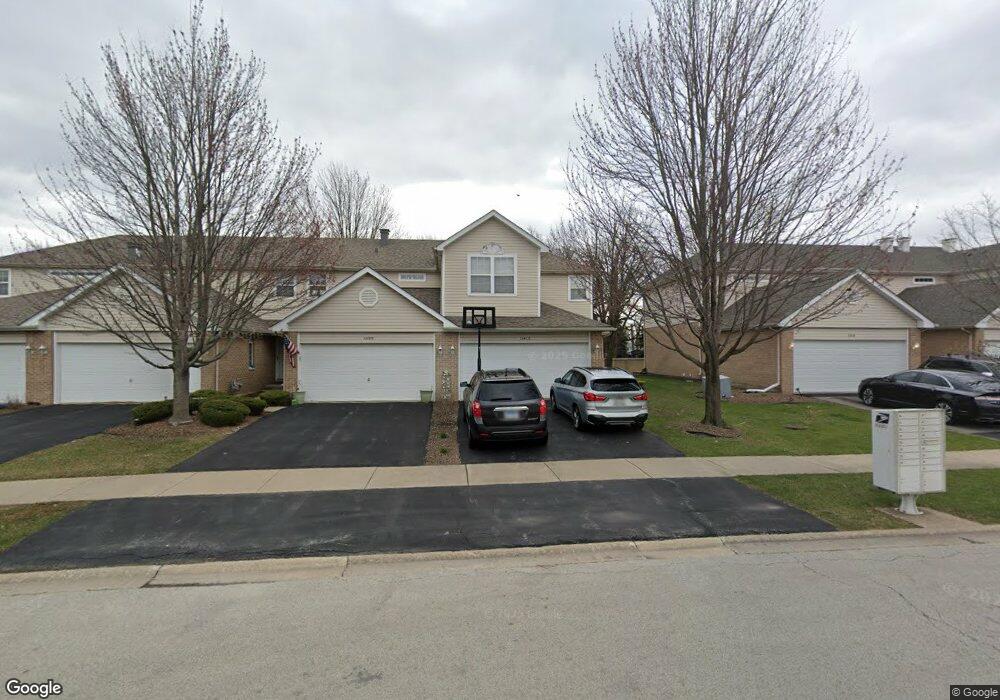
This home is located at 11413 S Peach Tree Ln Unit 11413, Alsip, IL 60803 and is currently estimated at $268,607, approximately $158 per square foot. 11413 S Peach Tree Ln Unit 11413 is a home located in Cook County with nearby schools including Hazelgreen Elementary School, Prairie Jr High School, and Harold L. Richards High School.
Ownership History
Date
Name
Owned For
Owner Type
Purchase Details
Closed on
Jun 30, 2005
Sold by
Dillard Terrance
Bought by
Dillard Terrance and Dillard Lael
Current Estimated Value
Home Financials for this Owner
Home Financials are based on the most recent Mortgage that was taken out on this home.
Original Mortgage
$204,200
Outstanding Balance
$106,733
Interest Rate
5.68%
Mortgage Type
New Conventional
Estimated Equity
$161,874
Purchase Details
Closed on
Dec 22, 1998
Sold by
First National Bank Of Evergreen Park
Bought by
Dillard Terrance L
Home Financials for this Owner
Home Financials are based on the most recent Mortgage that was taken out on this home.
Original Mortgage
$141,500
Interest Rate
6.78%
Mortgage Type
FHA
Create a Home Valuation Report for This Property
The Home Valuation Report is an in-depth analysis detailing your home's value as well as a comparison with similar homes in the area
Home Values in the Area
Average Home Value in this Area
Purchase History
| Date | Buyer | Sale Price | Title Company |
|---|---|---|---|
| Dillard Terrance | -- | Nationwide Appraisal & Title | |
| Dillard Terrance L | $157,500 | -- |
Source: Public Records
Mortgage History
| Date | Status | Borrower | Loan Amount |
|---|---|---|---|
| Open | Dillard Terrance | $204,200 | |
| Previous Owner | Dillard Terrance L | $141,500 |
Source: Public Records
Tax History Compared to Growth
Tax History
| Year | Tax Paid | Tax Assessment Tax Assessment Total Assessment is a certain percentage of the fair market value that is determined by local assessors to be the total taxable value of land and additions on the property. | Land | Improvement |
|---|---|---|---|---|
| 2024 | $6,464 | $22,517 | $2,181 | $20,336 |
| 2023 | $4,370 | $22,517 | $2,181 | $20,336 |
| 2022 | $4,370 | $14,374 | $3,173 | $11,201 |
| 2021 | $4,200 | $14,372 | $3,172 | $11,200 |
| 2020 | $4,234 | $14,372 | $3,172 | $11,200 |
| 2019 | $4,986 | $16,221 | $2,875 | $13,346 |
| 2018 | $4,794 | $16,221 | $2,875 | $13,346 |
| 2017 | $4,851 | $16,221 | $2,875 | $13,346 |
| 2016 | $3,728 | $12,173 | $2,379 | $9,794 |
| 2015 | $6,858 | $20,572 | $2,379 | $18,193 |
| 2014 | $6,644 | $20,572 | $2,379 | $18,193 |
| 2013 | $4,292 | $15,728 | $2,379 | $13,349 |
Source: Public Records
Map
Nearby Homes
- 5356 W Dixie Dr Unit 5356
- 11242 S Avon Ave
- 11608 S Leamington Ave
- 11123 S Leamington Ave
- 5520 W 115th St Unit 101
- 11756 S Leamington Ave
- 11600 S Lamon Ave
- 5111 Deblin Ln Unit 3B
- 5120 Deblin Ln
- 11022 Deblin Ln
- 11001 Deblin Ln Unit 203
- 5303 W 109th St Unit 5303
- 11903 S Laramie Ave
- 11010 Central Ave Unit 3A
- 11553 S Joalyce Dr
- 4917 W 109th St Unit 202
- 10833 Long Ave
- 11000 Central Ave Unit 2C
- 4905 W 109th St Unit 202
- 4829 W 109th St Unit 203
- 11409 S Peach Tree Ln Unit 11409
- 11405 S Peach Tree Ln Unit 11405
- 11401 S Peach Tree Ln Unit 11401
- 11419 S Peach Tree Ln Unit 11419
- 11423 S Peach Tree Ln Unit 11423
- 11427 S Peach Tree Ln Unit 11427
- 11359 S Peach Tree Ln Unit 11359
- 11355 S Peach Tree Ln Unit 11355
- 11351 S Peach Tree Ln Unit 11351
- 11412 S Peach Tree Ln
- 11420 S Peach Tree Ln
- 11433 S Peach Tree Ln Unit 11433
- 11437 S Peach Tree Ln Unit 11437
- 11428 S Peach Tree Ln
- 11441 S Peach Tree Ln Unit 11441
- 11445 S Peach Tree Ln Unit 11445
- 5221 W Mint Julip Dr Unit 5221
- 5221 W Mint Julip Dr Unit 5320
- 5221 W Mint Julip Dr
- 11350 S Peach Tree Ln Unit 11350