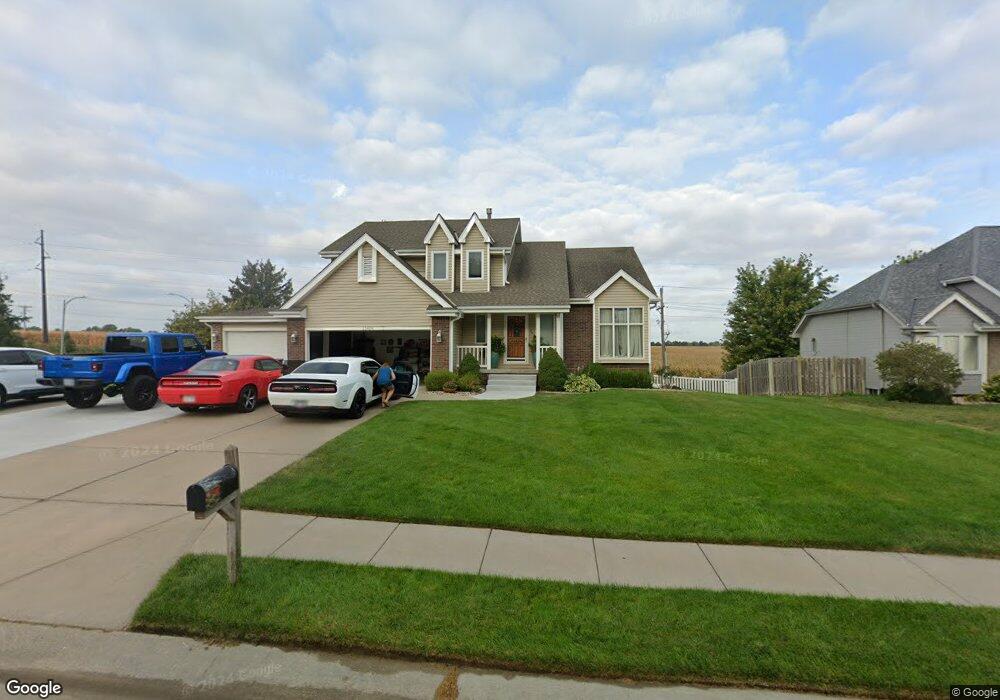
11414 S 47th St Papillion, NE 68133
Estimated Value: $402,284 - $456,000
4
Beds
5
Baths
2,806
Sq Ft
$153/Sq Ft
Est. Value
About This Home
This home is located at 11414 S 47th St, Papillion, NE 68133 and is currently estimated at $429,071, approximately $152 per square foot. 11414 S 47th St is a home located in Sarpy County with nearby schools including Anderson Grove Elementary School, Papillion Middle School, and Papillion La Vista South High School.
Ownership History
Date
Name
Owned For
Owner Type
Purchase Details
Closed on
Apr 22, 2006
Sold by
Elshaw John J and Elshaw Donna M
Bought by
Serratore Vince and Serratore Karen
Current Estimated Value
Home Financials for this Owner
Home Financials are based on the most recent Mortgage that was taken out on this home.
Original Mortgage
$156,000
Outstanding Balance
$89,492
Interest Rate
6.33%
Mortgage Type
Fannie Mae Freddie Mac
Estimated Equity
$339,579
Purchase Details
Closed on
Sep 9, 2002
Sold by
Trevino Martha
Bought by
Elshaw John J and Elshaw Donna M
Home Financials for this Owner
Home Financials are based on the most recent Mortgage that was taken out on this home.
Original Mortgage
$184,350
Interest Rate
6.25%
Mortgage Type
VA
Purchase Details
Closed on
Feb 8, 2000
Sold by
Furmanski Jr Robert W and Furmanski Margaret A
Bought by
Trevino Martha
Home Financials for this Owner
Home Financials are based on the most recent Mortgage that was taken out on this home.
Original Mortgage
$138,000
Interest Rate
7%
Create a Home Valuation Report for This Property
The Home Valuation Report is an in-depth analysis detailing your home's value as well as a comparison with similar homes in the area
Home Values in the Area
Average Home Value in this Area
Purchase History
| Date | Buyer | Sale Price | Title Company |
|---|---|---|---|
| Serratore Vince | $195,000 | None Available | |
| Elshaw John J | $179,000 | -- | |
| Trevino Martha | $164,000 | -- |
Source: Public Records
Mortgage History
| Date | Status | Borrower | Loan Amount |
|---|---|---|---|
| Open | Serratore Vince | $156,000 | |
| Closed | Elshaw John J | $184,350 | |
| Closed | Trevino Martha | $138,000 |
Source: Public Records
Tax History Compared to Growth
Tax History
| Year | Tax Paid | Tax Assessment Tax Assessment Total Assessment is a certain percentage of the fair market value that is determined by local assessors to be the total taxable value of land and additions on the property. | Land | Improvement |
|---|---|---|---|---|
| 2025 | $5,553 | $330,009 | $51,000 | $279,009 |
| 2024 | $6,230 | $320,860 | $48,000 | $272,860 |
| 2023 | $6,230 | $297,858 | $45,000 | $252,858 |
| 2022 | $5,775 | $260,521 | $40,000 | $220,521 |
| 2021 | $5,440 | $241,913 | $40,000 | $201,913 |
| 2020 | $5,216 | $230,669 | $34,000 | $196,669 |
| 2019 | $4,868 | $215,454 | $34,000 | $181,454 |
| 2018 | $4,507 | $196,654 | $30,000 | $166,654 |
| 2017 | $4,242 | $185,110 | $30,000 | $155,110 |
| 2016 | $4,073 | $178,013 | $28,000 | $150,013 |
| 2015 | $4,023 | $176,299 | $28,000 | $148,299 |
| 2014 | $4,292 | $186,882 | $28,000 | $158,882 |
| 2012 | -- | $177,711 | $28,000 | $149,711 |
Source: Public Records
Map
Nearby Homes
- 11308 S 47th St
- 4320 Longview St
- 4917 Shannon Dr
- 4918 Fountain Dr
- 4217 Longview St
- 11406 S 43rd St
- 5008 Westlake Cir
- 5004 Westlake Cir
- 5114 Timberridge Dr
- 4614 Windcrest Dr
- 4305 Barksdale Dr
- 4407 Amos Gates Dr
- 4714 Coffey St
- 4724 Coffey St
- 11903 S 49th St
- 11809 Quail Dr
- 11727 Quail Dr
- 4510 Barksdale Dr
- 4406 Barksdale Dr
- 4557 Barksdale Dr
- 11414 S 47th Street St
- 4608 Hilltop St
- 11410 S 47th St
- 11408 S 47th St
- 11409 S 47th St
- 4606 Hilltop St
- 11406 S 47th St
- 4605 Longview St
- 4601 Longview St
- 4610 Longview St
- 4511 Longview St
- 4608 Longview St
- 4509 Longview St
- 4606 Longview St
- 4507 Longview St
- 4604 Longview St
- 4609 Edgerton Dr
- 4602 Longview St
- 4607 Edgerton Dr
- 4605 Edgerton Dr