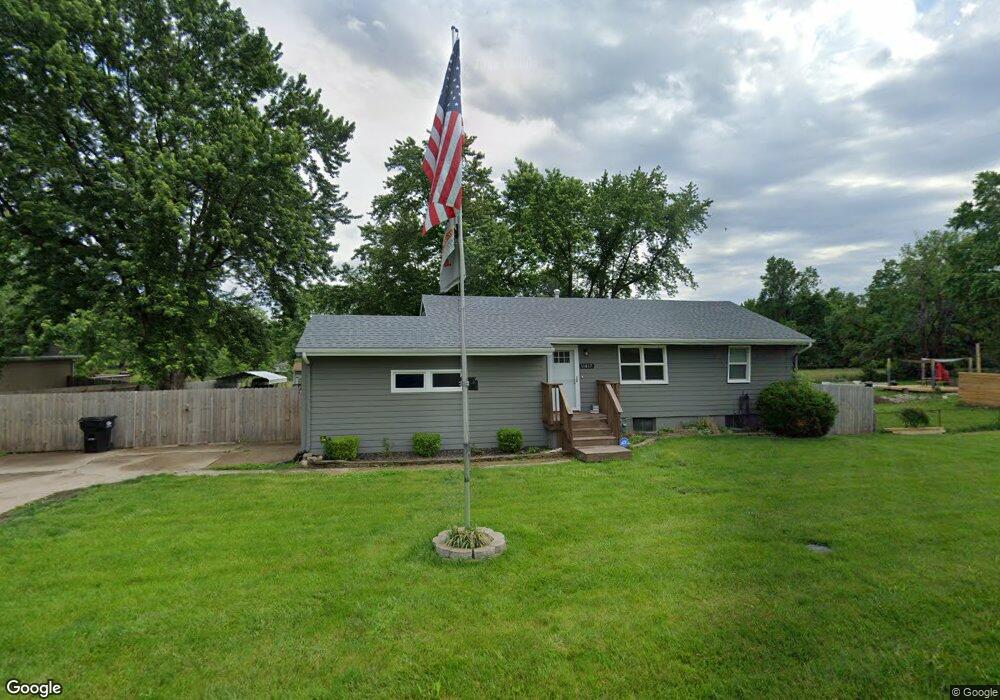
11417 E 56th Terrace Raytown, MO 64133
Estimated Value: $166,907 - $205,000
3
Beds
2
Baths
768
Sq Ft
$236/Sq Ft
Est. Value
About This Home
This home is located at 11417 E 56th Terrace, Raytown, MO 64133 and is currently estimated at $180,977, approximately $235 per square foot. 11417 E 56th Terrace is a home located in Jackson County with nearby schools including Fleetridge Elementary School, Raytown Middle School, and Raytown South High School.
Ownership History
Date
Name
Owned For
Owner Type
Purchase Details
Closed on
Sep 15, 2021
Sold by
Smith Harold and Smith Patricia
Bought by
Ford Dallas Quaid
Current Estimated Value
Home Financials for this Owner
Home Financials are based on the most recent Mortgage that was taken out on this home.
Original Mortgage
$150,000
Outstanding Balance
$135,593
Interest Rate
2.8%
Mortgage Type
VA
Estimated Equity
$45,384
Purchase Details
Closed on
Mar 27, 2015
Sold by
Smith Harold and Smith Patricia
Bought by
Smith Harold Steven and Gillespie Debra Anne
Purchase Details
Closed on
Apr 12, 2014
Sold by
Webb Jeffrey and Webb Kristina
Bought by
Smith Harold and Smith Patricia
Purchase Details
Closed on
Aug 30, 2006
Sold by
Smith Harold and Smith Patricia
Bought by
Webb Jeffrey and Webb Kristina
Home Financials for this Owner
Home Financials are based on the most recent Mortgage that was taken out on this home.
Original Mortgage
$88,900
Interest Rate
6.79%
Mortgage Type
Seller Take Back
Create a Home Valuation Report for This Property
The Home Valuation Report is an in-depth analysis detailing your home's value as well as a comparison with similar homes in the area
Home Values in the Area
Average Home Value in this Area
Purchase History
| Date | Buyer | Sale Price | Title Company |
|---|---|---|---|
| Ford Dallas Quaid | -- | Alpha Title Gu | |
| Smith Harold Steven | -- | Accommodation | |
| Smith Harold | -- | None Available | |
| Webb Jeffrey | -- | First American Title Company |
Source: Public Records
Mortgage History
| Date | Status | Borrower | Loan Amount |
|---|---|---|---|
| Open | Ford Dallas Quaid | $150,000 | |
| Previous Owner | Webb Jeffrey | $88,900 |
Source: Public Records
Tax History
| Year | Tax Paid | Tax Assessment Tax Assessment Total Assessment is a certain percentage of the fair market value that is determined by local assessors to be the total taxable value of land and additions on the property. | Land | Improvement |
|---|---|---|---|---|
| 2025 | $1,547 | $19,724 | $7,019 | $12,705 |
| 2024 | $1,547 | $17,151 | $5,805 | $11,346 |
| 2023 | $1,537 | $17,151 | $3,703 | $13,448 |
| 2022 | $1,734 | $18,430 | $4,289 | $14,141 |
| 2021 | $1,740 | $18,430 | $4,289 | $14,141 |
| 2020 | $1,677 | $17,598 | $4,289 | $13,309 |
| 2019 | $1,668 | $17,598 | $4,289 | $13,309 |
| 2018 | $1,402 | $15,316 | $3,733 | $11,583 |
| 2017 | $1,402 | $15,316 | $3,733 | $11,583 |
| 2016 | $1,359 | $14,932 | $3,327 | $11,605 |
Source: Public Records
Map
Nearby Homes
- 5608 Woodson Rd
- 12000 E 56th Terrace
- 5813 Harvard Ave
- 5425 Appleton Ave
- 5305 Ridgeway Ave
- 5933 Sterling Ave
- 10905 E 59th St
- 11013 E 53rd Terrace
- 12124 E 54th St
- 6100 Englewood Ave
- 11213 E 61st St
- 10909 E 60th Terrace
- 12417 E 58th Terrace
- 5117 Woodson Rd
- 5433 Willow Ave
- 5821 Marion Ave
- 11600 E 62nd St
- 11405 E 51 St S
- 11601 E 62nd St
- 5212 Hedges Ave
- 11425 E 56th Terrace
- 11405 E 56th Terrace
- 11427 E 56th Terrace
- 11420 E 56th Terrace
- 5616 Woodson Rd
- 5620 Woodson Rd
- 11408 E 56th Terrace
- 11313 E 56th Terrace
- 5604 Woodson Rd
- 11314 E 56th Terrace
- 5602 Woodson Rd
- 5706 Woodson Rd
- 5629 Woodson Rd
- 11312 E 56th Terrace
- 5625 Woodson Rd
- 5627 Woodson Rd
- 11416 E 57th Terrace
- 11420 E 57th Terrace
- 5613 Woodson Rd
- 5637 Woodson Rd
Your Personal Tour Guide
Ask me questions while you tour the home.