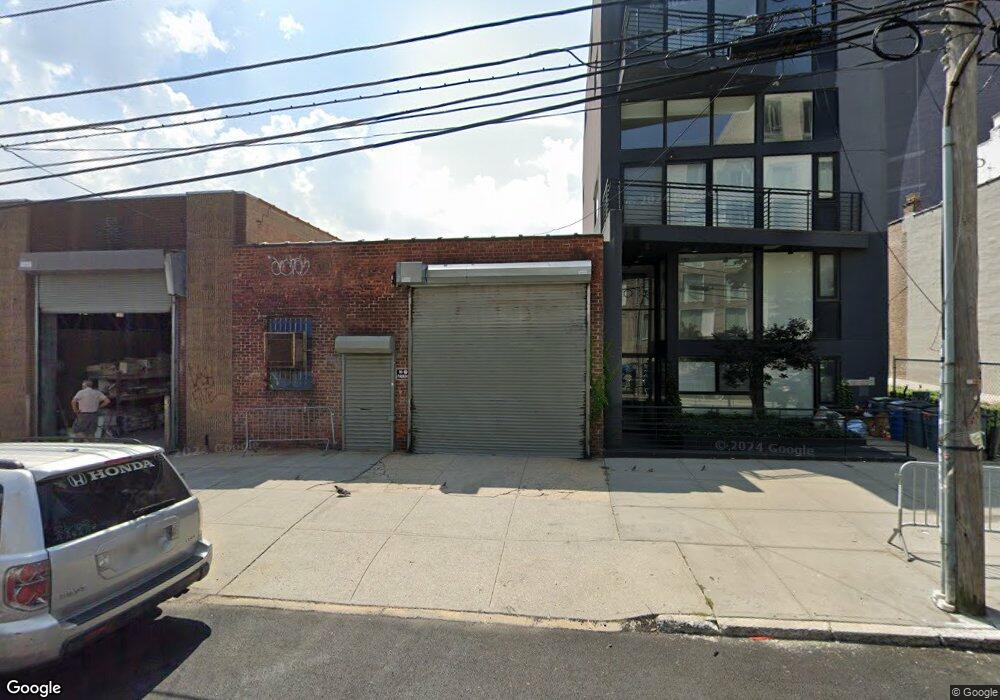
1142 31st Ave Unit S3 Astoria, NY 11106
Astoria NeighborhoodEstimated Value: $792,000
--
Bed
--
Bath
49
Sq Ft
$16,163/Sq Ft
Est. Value
About This Home
This home is located at 1142 31st Ave Unit S3, Astoria, NY 11106 and is currently estimated at $792,000, approximately $16,163 per square foot. 1142 31st Ave Unit S3 is a home located in Queens County with nearby schools including P.S.171 Peter G.Van Alst Elementary School, I.S. 126Q Albert Shanker School Community School, and Long Island City High School.
Create a Home Valuation Report for This Property
The Home Valuation Report is an in-depth analysis detailing your home's value as well as a comparison with similar homes in the area
Home Values in the Area
Average Home Value in this Area
Tax History Compared to Growth
Tax History
| Year | Tax Paid | Tax Assessment Tax Assessment Total Assessment is a certain percentage of the fair market value that is determined by local assessors to be the total taxable value of land and additions on the property. | Land | Improvement |
|---|---|---|---|---|
| 2025 | $126 | $1,278 | $333 | $945 |
| 2024 | $126 | $1,188 | $333 | $855 |
| 2023 | $144 | $1,350 | $333 | $1,017 |
| 2022 | $149 | $1,381 | $333 | $1,048 |
| 2021 | $135 | $1,260 | $333 | $927 |
| 2020 | $146 | $1,530 | $333 | $1,197 |
| 2019 | $138 | $1,413 | $333 | $1,080 |
| 2018 | $132 | $1,253 | $333 | $920 |
| 2017 | $125 | $1,186 | $333 | $853 |
| 2016 | $120 | $1,186 | $333 | $853 |
| 2015 | $82 | $1,120 | $333 | $787 |
| 2014 | $82 | $1,116 | $322 | $794 |
Source: Public Records
Map
Nearby Homes
- 11-24 31st Ave Unit 15B
- 11-24 31st Ave Unit 18B
- 11-24 31st Ave Unit 10-E
- 11-24 31st Ave
- 11-24 31st Ave Unit 12-C
- 11-24 31st Ave Unit 12A
- 11-24 31st Ave Unit 3A
- 11-24 31st Ave Unit 13C
- 11-32 31st Ave Unit 3D
- 11-32 31st Ave Unit 4 A
- 11-32 31st Ave Unit 2B
- 11-32 31st Ave Unit 6 B
- 11-32 31st Ave Unit 2D
- 11-32 31st Ave Unit 4D
- 11-32 31st Ave Unit 1A
- 3085 Vernon Blvd Unit 3L
- 31-13 12th St
- 12-14 31st Ave Unit 7 D
- 30-55 Vernon Blvd Unit 6E
- 30-55 Vernon Blvd Unit 5D
- 1142 31st Ave Unit 4B
- 1142 31st Ave Unit 4A
- 1142 31st Ave Unit 3B
- 1142 31st Ave Unit 3A
- 1142 31st Ave Unit 2A
- 1142 31st Ave Unit 1B
- 1142 31st Ave Unit 1A
- 1142 31st Ave Unit S5
- 1142 31st Ave Unit S1
- 1142 31st Ave Unit S2
- 1142 31st Ave
- 1142 31st Ave Unit S4
- 11-42 31st Ave Unit 4B
- 11-42 31st Ave Unit 4A
- 11-42 31st Ave Unit 3B
- 11-42 31st Ave Unit 1B
- 11-42 31st Ave Unit 1A
- 11-42 31st Ave Unit 3A
- 11-42 31st Ave Unit 2A
- 1136 31st Ave