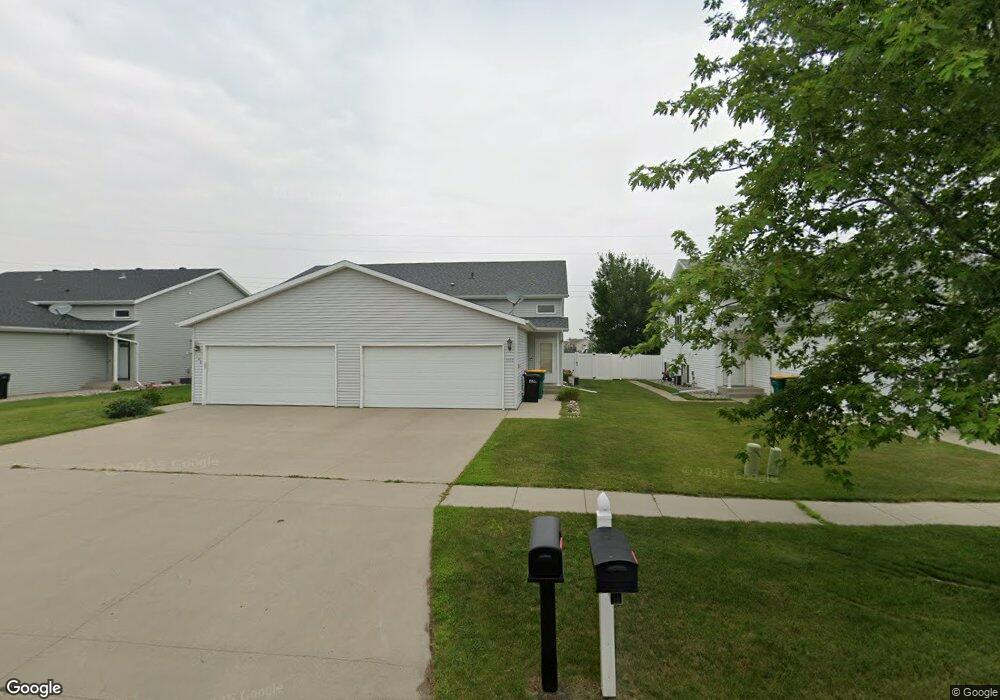
1142 38 1/2 Ave W West Fargo, ND 58078
Eagle Run NeighborhoodEstimated Value: $255,862 - $274,000
3
Beds
2
Baths
1,765
Sq Ft
$151/Sq Ft
Est. Value
About This Home
This home is located at 1142 38 1/2 Ave W, West Fargo, ND 58078 and is currently estimated at $266,716, approximately $151 per square foot. 1142 38 1/2 Ave W is a home located in Cass County with nearby schools including Aurora Elementary School, Liberty Middle School, and West Fargo Sheyenne High School.
Ownership History
Date
Name
Owned For
Owner Type
Purchase Details
Closed on
Nov 27, 2013
Sold by
Bjella Kelly D and Bjella Malory B
Bought by
Groos Jason M
Current Estimated Value
Home Financials for this Owner
Home Financials are based on the most recent Mortgage that was taken out on this home.
Original Mortgage
$140,050
Outstanding Balance
$105,048
Interest Rate
4.3%
Mortgage Type
VA
Estimated Equity
$161,668
Purchase Details
Closed on
Jun 19, 2008
Sold by
Winterqist Tracy G and Winterquist Tara L
Bought by
Bjella Kelly D and Lange Malory B
Home Financials for this Owner
Home Financials are based on the most recent Mortgage that was taken out on this home.
Original Mortgage
$135,572
Interest Rate
6.04%
Mortgage Type
FHA
Purchase Details
Closed on
Sep 26, 2005
Sold by
Jordahl Custom Homes Inc
Bought by
Winterquist Tracy G and Winterquist Tara L
Home Financials for this Owner
Home Financials are based on the most recent Mortgage that was taken out on this home.
Original Mortgage
$129,150
Interest Rate
5.93%
Mortgage Type
VA
Create a Home Valuation Report for This Property
The Home Valuation Report is an in-depth analysis detailing your home's value as well as a comparison with similar homes in the area
Home Values in the Area
Average Home Value in this Area
Purchase History
| Date | Buyer | Sale Price | Title Company |
|---|---|---|---|
| Groos Jason M | $146,000 | Fm Title | |
| Bjella Kelly D | -- | -- | |
| Winterquist Tracy G | -- | -- |
Source: Public Records
Mortgage History
| Date | Status | Borrower | Loan Amount |
|---|---|---|---|
| Open | Groos Jason M | $140,050 | |
| Previous Owner | Bjella Kelly D | $135,572 | |
| Previous Owner | Winterquist Tracy G | $129,150 |
Source: Public Records
Tax History Compared to Growth
Tax History
| Year | Tax Paid | Tax Assessment Tax Assessment Total Assessment is a certain percentage of the fair market value that is determined by local assessors to be the total taxable value of land and additions on the property. | Land | Improvement |
|---|---|---|---|---|
| 2024 | $3,149 | $120,200 | $18,000 | $102,200 |
| 2023 | $3,540 | $115,800 | $18,000 | $97,800 |
| 2022 | $3,221 | $103,250 | $18,000 | $85,250 |
| 2021 | $2,978 | $94,800 | $13,500 | $81,300 |
| 2020 | $2,851 | $91,800 | $13,500 | $78,300 |
| 2019 | $2,798 | $88,850 | $13,500 | $75,350 |
| 2018 | $2,739 | $90,100 | $13,500 | $76,600 |
| 2017 | $2,545 | $87,300 | $13,500 | $73,800 |
| 2016 | $2,254 | $85,100 | $13,500 | $71,600 |
| 2015 | $2,097 | $74,400 | $5,700 | $68,700 |
| 2014 | $2,074 | $69,550 | $5,700 | $63,850 |
| 2013 | $1,970 | $65,950 | $5,700 | $60,250 |
Source: Public Records
Map
Nearby Homes
- 1040 39th Ave W
- 909 38 1 2 Ave W
- 3662 N Sedona Ct
- 1156 42nd Ave W Unit A
- 1054 42nd Ave W
- 1236 S Beach Way
- 1168 43rd Ave W
- 1381 Westport Beach Way
- 4509 11th St W
- 4507 Newport Ln
- 4534 Westport Pkwy
- 945 31st Ave W
- 4717 11th St W
- 922 31st Ave W
- 1015 29th Ave W
- 4757 11th St W
- 1097 Hickory Ln
- 1089 Hickory Ln
- 939 Eaglewood Ave
- 1082 Larkin Ln
- 1142 38 1 2 Ave W
- 1146 38 1 2 Ave W
- 1138 38 1/2 Ave W
- 1146 38 1/2 Ave W
- 1138 38 1 2 Ave W
- 1134 38 1/2 Ave W
- 1150 38 1/2 Ave W
- 1130 38 1 2 Ave W
- 1154 38 1/2 Ave W
- 1130 38 1/2 Ave W
- 1158 38 1/2 Ave W
- 1126 38 1/2 Ave W
- 1158 38 1 2 Ave W
- 1162 38 1 2 Ave W
- 1122 38 1 2 Ave W
- 1122 38 1/2 Ave W
- 1162 38 1/2 Ave W
- 1139 38 1/2 Ave W
- 1143 38 1/2 Ave W
- 1135 38 1/2 Ave W