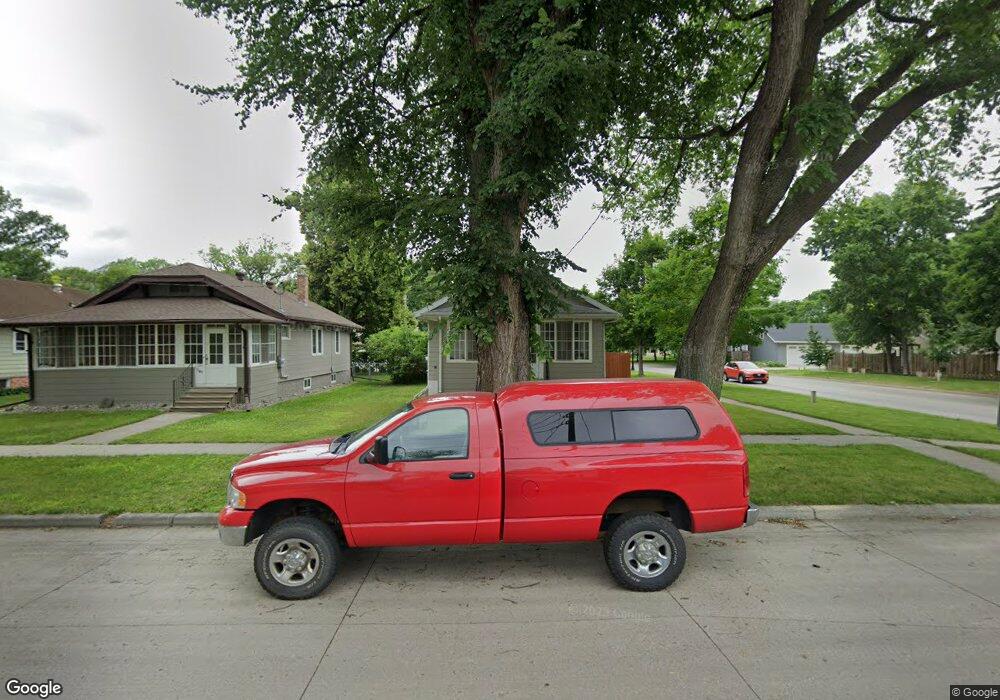
1142 4th St N Fargo, ND 58102
Horace Mann NeighborhoodEstimated Value: $202,000 - $227,790
2
Beds
1
Bath
1,536
Sq Ft
$140/Sq Ft
Est. Value
About This Home
This home is located at 1142 4th St N, Fargo, ND 58102 and is currently estimated at $214,948, approximately $139 per square foot. 1142 4th St N is a home located in Cass County with nearby schools including Horace Mann Roosevelt Elementary School, Ben Franklin Middle School, and North High School.
Ownership History
Date
Name
Owned For
Owner Type
Purchase Details
Closed on
Jun 23, 2017
Sold by
Kounovsky Samantha
Bought by
Madsen Brady M
Current Estimated Value
Home Financials for this Owner
Home Financials are based on the most recent Mortgage that was taken out on this home.
Original Mortgage
$152,193
Outstanding Balance
$126,697
Interest Rate
4.05%
Mortgage Type
New Conventional
Estimated Equity
$88,251
Purchase Details
Closed on
Oct 27, 2015
Sold by
Lutheran Social Services
Bought by
Kounovsky Samantha
Create a Home Valuation Report for This Property
The Home Valuation Report is an in-depth analysis detailing your home's value as well as a comparison with similar homes in the area
Home Values in the Area
Average Home Value in this Area
Purchase History
| Date | Buyer | Sale Price | Title Company |
|---|---|---|---|
| Madsen Brady M | $156,900 | Title Co | |
| Kounovsky Samantha | $72,500 | Fargo Title Inc |
Source: Public Records
Mortgage History
| Date | Status | Borrower | Loan Amount |
|---|---|---|---|
| Open | Madsen Brady M | $152,193 |
Source: Public Records
Tax History Compared to Growth
Tax History
| Year | Tax Paid | Tax Assessment Tax Assessment Total Assessment is a certain percentage of the fair market value that is determined by local assessors to be the total taxable value of land and additions on the property. | Land | Improvement |
|---|---|---|---|---|
| 2024 | $2,811 | $108,800 | $19,200 | $89,600 |
| 2023 | $2,962 | $96,300 | $19,200 | $77,100 |
| 2022 | $2,880 | $91,700 | $19,200 | $72,500 |
| 2021 | $2,612 | $83,350 | $19,200 | $64,150 |
| 2020 | $2,479 | $79,400 | $19,200 | $60,200 |
| 2019 | $2,481 | $79,400 | $11,400 | $68,000 |
| 2018 | $2,163 | $68,200 | $11,400 | $56,800 |
| 2017 | $2,060 | $64,950 | $11,400 | $53,550 |
| 2016 | $1,877 | $63,050 | $11,400 | $51,650 |
| 2015 | $1,512 | $60,150 | $7,800 | $52,350 |
| 2014 | $1,619 | $55,700 | $7,800 | $47,900 |
| 2013 | $684 | $53,050 | $7,800 | $45,250 |
Source: Public Records
Map
Nearby Homes