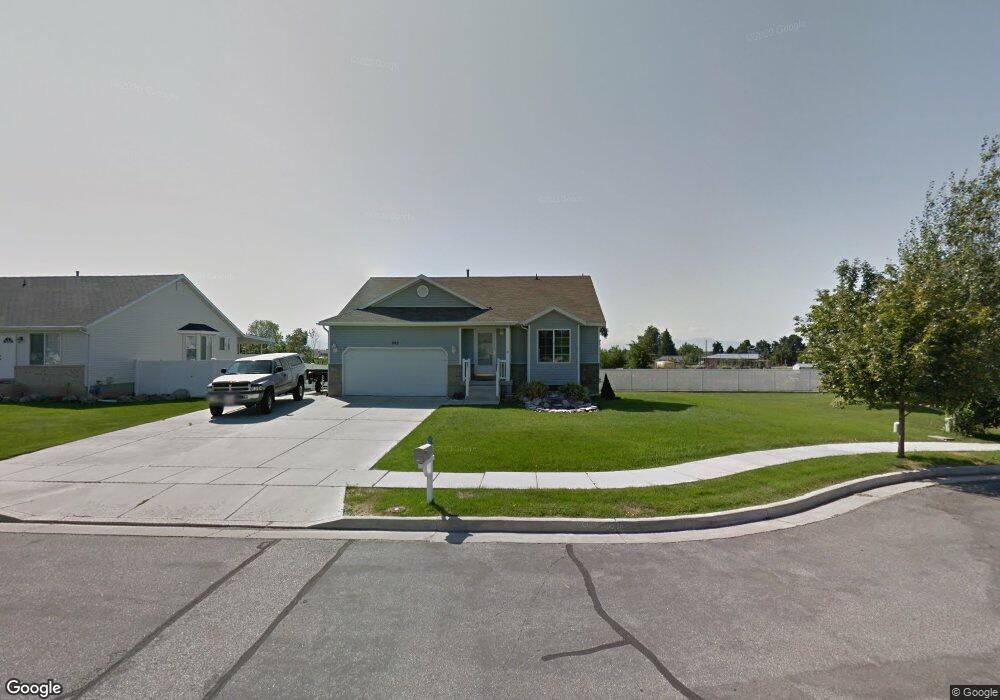
1142 E 1350 S Clearfield, UT 84015
Estimated Value: $447,000 - $498,000
3
Beds
2
Baths
1,234
Sq Ft
$382/Sq Ft
Est. Value
About This Home
This home is located at 1142 E 1350 S, Clearfield, UT 84015 and is currently estimated at $471,960, approximately $382 per square foot. 1142 E 1350 S is a home located in Davis County with nearby schools including South Clearfield Elementary School, North Davis Junior High School, and Clearfield High School.
Ownership History
Date
Name
Owned For
Owner Type
Purchase Details
Closed on
Aug 17, 2001
Sold by
Gmw Development Inc
Bought by
Kent Brooke
Current Estimated Value
Home Financials for this Owner
Home Financials are based on the most recent Mortgage that was taken out on this home.
Original Mortgage
$141,897
Outstanding Balance
$55,512
Interest Rate
7.19%
Mortgage Type
FHA
Estimated Equity
$416,448
Create a Home Valuation Report for This Property
The Home Valuation Report is an in-depth analysis detailing your home's value as well as a comparison with similar homes in the area
Home Values in the Area
Average Home Value in this Area
Purchase History
| Date | Buyer | Sale Price | Title Company |
|---|---|---|---|
| Kent Brooke | -- | Bonneville Title Company Inc |
Source: Public Records
Mortgage History
| Date | Status | Borrower | Loan Amount |
|---|---|---|---|
| Open | Kent Brooke | $141,897 |
Source: Public Records
Tax History Compared to Growth
Tax History
| Year | Tax Paid | Tax Assessment Tax Assessment Total Assessment is a certain percentage of the fair market value that is determined by local assessors to be the total taxable value of land and additions on the property. | Land | Improvement |
|---|---|---|---|---|
| 2025 | $2,658 | $238,150 | $76,666 | $161,484 |
| 2024 | $2,571 | $232,100 | $73,264 | $158,836 |
| 2023 | $2,336 | $387,000 | $116,798 | $270,202 |
| 2022 | $2,590 | $232,100 | $66,569 | $165,531 |
| 2021 | $2,039 | $276,000 | $72,922 | $203,078 |
| 2020 | $1,777 | $239,000 | $61,753 | $177,247 |
| 2019 | $1,710 | $227,000 | $63,159 | $163,841 |
| 2018 | $1,670 | $216,000 | $53,257 | $162,743 |
| 2016 | $1,471 | $99,440 | $22,543 | $76,897 |
| 2015 | $1,376 | $88,715 | $22,543 | $66,172 |
| 2014 | $1,474 | $96,263 | $22,543 | $73,720 |
| 2013 | -- | $89,368 | $31,723 | $57,645 |
Source: Public Records
Map
Nearby Homes
- 1234 S 1050 E
- 1021 E 1225 S Unit A
- 897 E 1000 S
- 1596 N Main St Unit 2
- 1542 E 925 S
- 1548 E 925 S
- 1992 W Afton Cir
- 1954 Ann St
- 1665 W 1960 N
- 1606 W 1960 N
- 1847 John St
- 1740 N Gregory Dr
- 1900 N 1690 W
- 850 S 1650 E Unit D
- 865 S 1650 E Unit A
- 175 Ross Dr
- 460 E 1700 S Unit 1 & 2
- 875 S Depot St Unit C-312
- 875 S Depot St Unit A335
- 875 S Depot St Unit A336