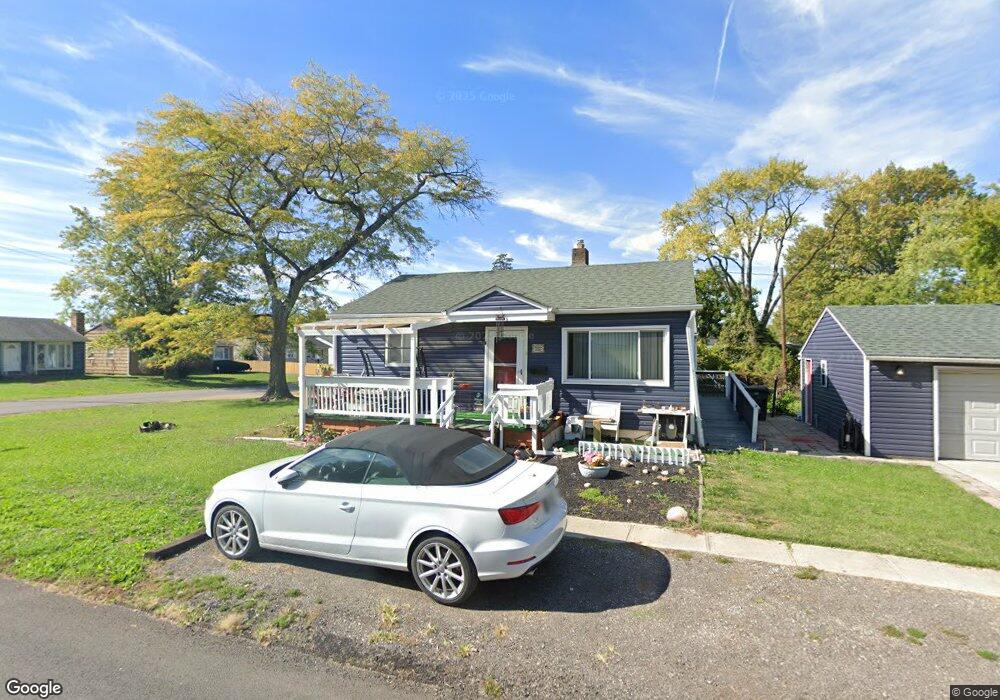
1142 E Woodrow Ave Columbus, OH 43207
Innis Gardens Village NeighborhoodEstimated Value: $128,000 - $167,000
2
Beds
1
Bath
775
Sq Ft
$195/Sq Ft
Est. Value
About This Home
This home is located at 1142 E Woodrow Ave, Columbus, OH 43207 and is currently estimated at $151,101, approximately $194 per square foot. 1142 E Woodrow Ave is a home with nearby schools including Moler Elementary School, South High School, and Summit Academy Community School-Columbus.
Ownership History
Date
Name
Owned For
Owner Type
Purchase Details
Closed on
Jan 31, 2025
Sold by
Johnson Tommie W and Johnson Brenda E
Bought by
Johnson Tommie W and Johnson Branda E
Current Estimated Value
Purchase Details
Closed on
Nov 4, 2010
Sold by
City Of Columbus
Bought by
Johnson Tommie W and Johnson Brenda E
Purchase Details
Closed on
Mar 25, 2008
Sold by
Hud
Bought by
City Of Collumbus
Purchase Details
Closed on
Aug 15, 2006
Sold by
Malone Vernon and Abn Amro Mortgage Group Inc
Bought by
Hud
Purchase Details
Closed on
Apr 4, 2001
Sold by
Diggs Linda and Diggs Linda F
Bought by
Malone Vernon
Purchase Details
Closed on
Sep 27, 1999
Sold by
Francis Marjorie A
Bought by
Diggs Linda and Malone Vernon
Home Financials for this Owner
Home Financials are based on the most recent Mortgage that was taken out on this home.
Original Mortgage
$50,473
Interest Rate
7.83%
Mortgage Type
FHA
Purchase Details
Closed on
Jul 11, 1967
Bought by
Francis Marjorie A
Create a Home Valuation Report for This Property
The Home Valuation Report is an in-depth analysis detailing your home's value as well as a comparison with similar homes in the area
Home Values in the Area
Average Home Value in this Area
Purchase History
| Date | Buyer | Sale Price | Title Company |
|---|---|---|---|
| Johnson Tommie W | -- | Equity Settlement Services | |
| Johnson Tommie W | -- | Attorney | |
| City Of Collumbus | -- | Lakeside Ti | |
| Hud | $40,000 | None Available | |
| Malone Vernon | -- | -- | |
| Diggs Linda | $50,500 | Chicago Title | |
| Francis Marjorie A | -- | -- |
Source: Public Records
Mortgage History
| Date | Status | Borrower | Loan Amount |
|---|---|---|---|
| Previous Owner | Diggs Linda | $50,473 |
Source: Public Records
Tax History Compared to Growth
Tax History
| Year | Tax Paid | Tax Assessment Tax Assessment Total Assessment is a certain percentage of the fair market value that is determined by local assessors to be the total taxable value of land and additions on the property. | Land | Improvement |
|---|---|---|---|---|
| 2024 | $1,343 | $39,730 | $11,380 | $28,350 |
| 2023 | $1,354 | $39,725 | $11,375 | $28,350 |
| 2022 | $335 | $15,200 | $4,380 | $10,820 |
| 2021 | $335 | $15,200 | $4,380 | $10,820 |
| 2020 | $336 | $15,200 | $4,380 | $10,820 |
| 2019 | $234 | $12,600 | $3,780 | $8,820 |
| 2018 | $253 | $12,600 | $3,780 | $8,820 |
| 2017 | $268 | $12,600 | $3,780 | $8,820 |
| 2016 | $302 | $13,310 | $2,490 | $10,820 |
| 2015 | $274 | $13,310 | $2,490 | $10,820 |
| 2014 | $802 | $13,310 | $2,490 | $10,820 |
| 2013 | $417 | $14,000 | $2,625 | $11,375 |
Source: Public Records
Map
Nearby Homes
- 1777 Lockbourne Rd
- 1861 Berkeley Rd
- 1833 Berkeley Rd
- 1680 Linwood Ave
- 990 Reeb Ave
- 1642 Berkeley Rd
- 1580 Linwood Ave
- 1710 S Champion Ave
- 1548 Wilson Ave
- 1360 Frebis Ave
- 1619 Liscomb Rd
- 1418-1422 Miller Ave
- 1472 S Champion Ave
- 1673 Liscomb Rd
- 1871 Holburn Ave Unit 873
- 1438 E Gates St
- 1366 Lockbourne Rd
- 1365 Linwood Ave
- 0 Moler Rd
- 1363 Kelton Ave
- 1136 E Woodrow Ave
- 1132 E Woodrow Ave
- 1154 E Woodrow Ave
- 1126 E Woodrow Ave
- 1160 E Woodrow Ave
- 1137 E Woodrow Ave
- 1118 E Woodrow Ave
- 1166 E Woodrow Ave
- 1129 E Woodrow Ave
- 1151 Smith Rd
- 1123 E Woodrow Ave
- 1920 Ellsworth Ave
- 1137 Smith Rd
- 1161 Smith Rd
- 1112 E Woodrow Ave
- 1172 E Woodrow Ave
- 1115 E Woodrow Ave
- 1932 Ellsworth Ave
- 1129 Smith Rd
- 1106 E Woodrow Ave