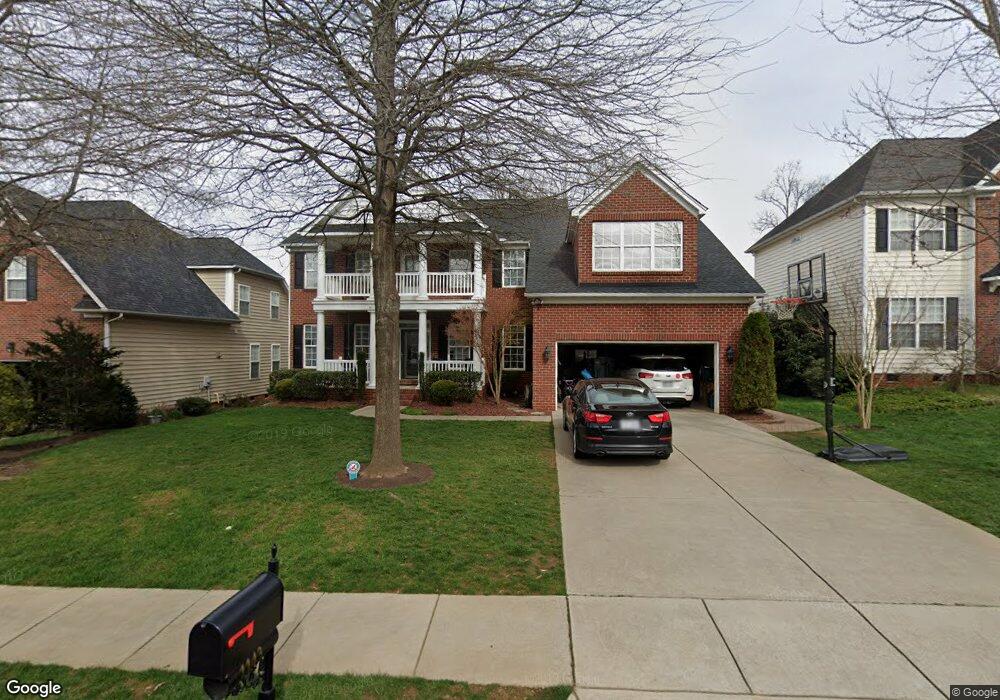
1143 Anduin Falls Dr Charlotte, NC 28269
Estimated Value: $647,246 - $723,000
5
Beds
4
Baths
3,777
Sq Ft
$180/Sq Ft
Est. Value
About This Home
This home is located at 1143 Anduin Falls Dr, Charlotte, NC 28269 and is currently estimated at $680,812, approximately $180 per square foot. 1143 Anduin Falls Dr is a home located in Cabarrus County with nearby schools including Cox Mill Elementary School, Harold E. Winkler Middle School, and Cox Mill High School.
Ownership History
Date
Name
Owned For
Owner Type
Purchase Details
Closed on
Mar 1, 2013
Sold by
Pfeiffer Monica Lynette and Pfeiffer William Stephen
Bought by
Pfeiffer Monica Lynette
Current Estimated Value
Purchase Details
Closed on
Jun 30, 2005
Sold by
D R Horton Inc
Bought by
Pfeiffer William Stephen and Pfeiffer Monica Lynette
Home Financials for this Owner
Home Financials are based on the most recent Mortgage that was taken out on this home.
Original Mortgage
$349,060
Outstanding Balance
$181,153
Interest Rate
5.57%
Mortgage Type
Fannie Mae Freddie Mac
Estimated Equity
$499,659
Purchase Details
Closed on
Feb 8, 2005
Sold by
Drhi Inc
Bought by
D R Horton Inc
Purchase Details
Closed on
Feb 1, 2005
Sold by
Rhein Highland Creek Llc
Bought by
Drhi Inc
Create a Home Valuation Report for This Property
The Home Valuation Report is an in-depth analysis detailing your home's value as well as a comparison with similar homes in the area
Home Values in the Area
Average Home Value in this Area
Purchase History
| Date | Buyer | Sale Price | Title Company |
|---|---|---|---|
| Pfeiffer Monica Lynette | -- | None Available | |
| Pfeiffer William Stephen | $388,000 | -- | |
| D R Horton Inc | -- | -- | |
| Drhi Inc | $246,500 | -- |
Source: Public Records
Mortgage History
| Date | Status | Borrower | Loan Amount |
|---|---|---|---|
| Open | Pfeiffer William Stephen | $349,060 |
Source: Public Records
Tax History
| Year | Tax Paid | Tax Assessment Tax Assessment Total Assessment is a certain percentage of the fair market value that is determined by local assessors to be the total taxable value of land and additions on the property. | Land | Improvement |
|---|---|---|---|---|
| 2025 | $6,075 | $609,950 | $100,000 | $509,950 |
| 2024 | $6,104 | $612,850 | $100,000 | $512,850 |
| 2023 | $5,288 | $433,410 | $67,000 | $366,410 |
| 2022 | $5,288 | $433,410 | $67,000 | $366,410 |
| 2021 | $5,288 | $433,410 | $67,000 | $366,410 |
| 2020 | $5,288 | $433,410 | $67,000 | $366,410 |
| 2019 | $4,619 | $378,620 | $60,000 | $318,620 |
| 2018 | $4,543 | $378,620 | $60,000 | $318,620 |
| 2017 | $4,468 | $378,620 | $60,000 | $318,620 |
| 2016 | $2,650 | $328,050 | $42,000 | $286,050 |
| 2015 | $3,805 | $322,420 | $42,000 | $280,420 |
| 2014 | $3,805 | $322,420 | $42,000 | $280,420 |
Source: Public Records
Map
Nearby Homes
- 9529 Numenore Dr
- 10357 Montrose Dr NW
- 9637 Garamont Pkwy NW
- 1701 Wilburn Park Ln NW
- 930 Parkland Place NW
- 966 Parkland Place NW
- 964 Bellegray Ln NW
- 9610 McGruden Dr NW
- 10112 Montrose Dr NW
- 1930 Wilburn Park Ln NW
- 1432 Bedlington Dr NW
- 1000 Bellegray Ln NW
- 781 Barossa Valley Dr NW
- 1086 MacAllum Dr NW
- 10346 Falling Leaf Dr NW
- 10708 Haddington Dr NW
- 9635 Herringbone Ln NW
- 9915 Nicole Ln
- 9650 Herringbone Ln NW
- 10620 Euclid Ave NW
- 1139 Anduin Falls Dr
- 1151 Anduin Falls Dr
- 1135 Anduin Falls Dr
- 1144 Anduin Falls Dr
- 1131 Anduin Falls Dr
- 1140 Anduin Falls Dr
- 1148 Anduin Falls Dr
- 9726 Aragorn Ln NW
- 9722 Aragorn Ln NW
- 1136 Anduin Falls Dr
- 9806 Aragorn Ln NW
- 9718 Aragorn Ln NW
- 1132 Anduin Falls Dr
- 1127 Anduin Falls Dr
- 9712 Aragorn Ln NW
- 9816 Aragorn Ln NW
- 1012 Anduin Falls Dr
- 1128 Anduin Falls Dr
- 1016 Anduin Falls Dr
- 1008 Anduin Falls Dr
Your Personal Tour Guide
Ask me questions while you tour the home.