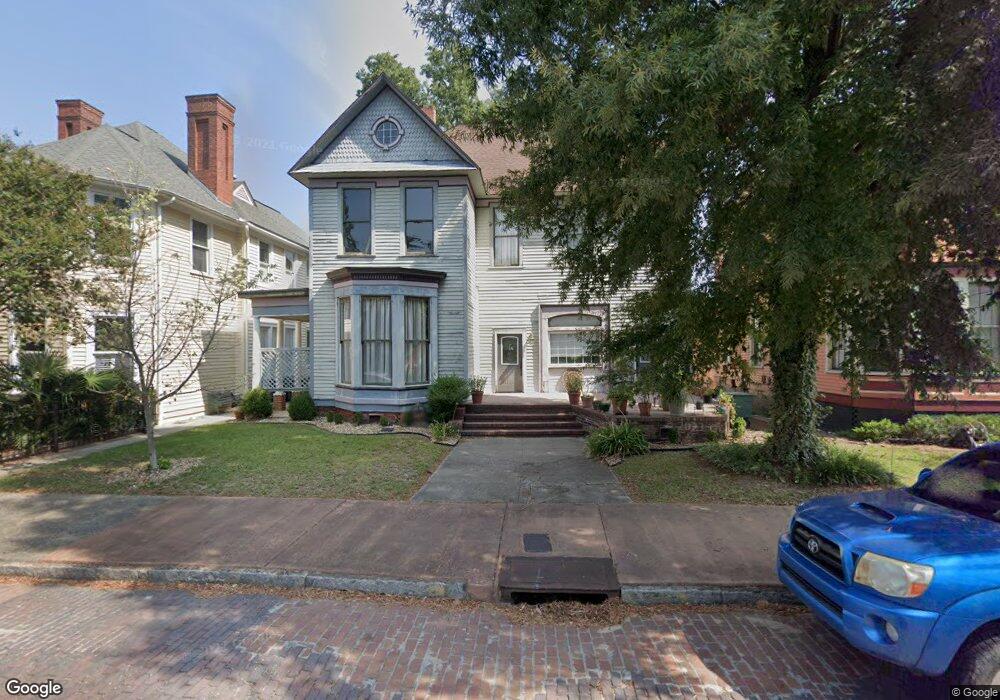
1143 Bond St Macon, GA 31201
InTown NeighborhoodEstimated Value: $273,000 - $322,000
3
Beds
4
Baths
4,271
Sq Ft
$68/Sq Ft
Est. Value
About This Home
This home is located at 1143 Bond St, Macon, GA 31201 and is currently estimated at $291,000, approximately $68 per square foot. 1143 Bond St is a home with nearby schools including Williams Elementary School, Miller Fine Arts Magnet Middle School, and Central High School.
Ownership History
Date
Name
Owned For
Owner Type
Purchase Details
Closed on
Feb 1, 2022
Sold by
Widner Matthew T
Bought by
Brick Road Properties Llc
Current Estimated Value
Purchase Details
Closed on
Dec 22, 2020
Sold by
Lemoine Kevin J
Bought by
Widner Matthew T
Home Financials for this Owner
Home Financials are based on the most recent Mortgage that was taken out on this home.
Original Mortgage
$161,250
Interest Rate
2.7%
Mortgage Type
Purchase Money Mortgage
Purchase Details
Closed on
Dec 15, 2005
Sold by
Powell Alan T
Bought by
Lemoine Kevin J
Home Financials for this Owner
Home Financials are based on the most recent Mortgage that was taken out on this home.
Original Mortgage
$123,500
Interest Rate
6.23%
Mortgage Type
New Conventional
Create a Home Valuation Report for This Property
The Home Valuation Report is an in-depth analysis detailing your home's value as well as a comparison with similar homes in the area
Home Values in the Area
Average Home Value in this Area
Purchase History
| Date | Buyer | Sale Price | Title Company |
|---|---|---|---|
| Brick Road Properties Llc | -- | Smith Hawkins Hollingsworth & | |
| Widner Matthew T | $150,000 | None Available | |
| Lemoine Kevin J | $130,000 | None Avilebel |
Source: Public Records
Mortgage History
| Date | Status | Borrower | Loan Amount |
|---|---|---|---|
| Previous Owner | Widner Matthew T | $161,250 | |
| Previous Owner | Lemoine Kevin J | $123,500 |
Source: Public Records
Tax History Compared to Growth
Tax History
| Year | Tax Paid | Tax Assessment Tax Assessment Total Assessment is a certain percentage of the fair market value that is determined by local assessors to be the total taxable value of land and additions on the property. | Land | Improvement |
|---|---|---|---|---|
| 2025 | $1,647 | $67,004 | $14,580 | $52,424 |
| 2024 | $1,702 | $67,004 | $14,580 | $52,424 |
| 2023 | $2,042 | $80,398 | $10,500 | $69,898 |
| 2022 | $2,416 | $69,793 | $12,751 | $57,042 |
| 2021 | $2,415 | $63,554 | $12,751 | $50,803 |
| 2020 | $2,202 | $56,708 | $12,144 | $44,564 |
| 2019 | $2,498 | $63,818 | $12,144 | $51,674 |
| 2018 | $4,546 | $63,818 | $12,144 | $51,674 |
| 2017 | $2,391 | $63,818 | $12,144 | $51,674 |
| 2016 | $2,208 | $63,818 | $12,144 | $51,674 |
| 2015 | $3,125 | $63,818 | $12,144 | $51,674 |
| 2014 | $1,198 | $63,818 | $12,144 | $51,674 |
Source: Public Records
Map
Nearby Homes