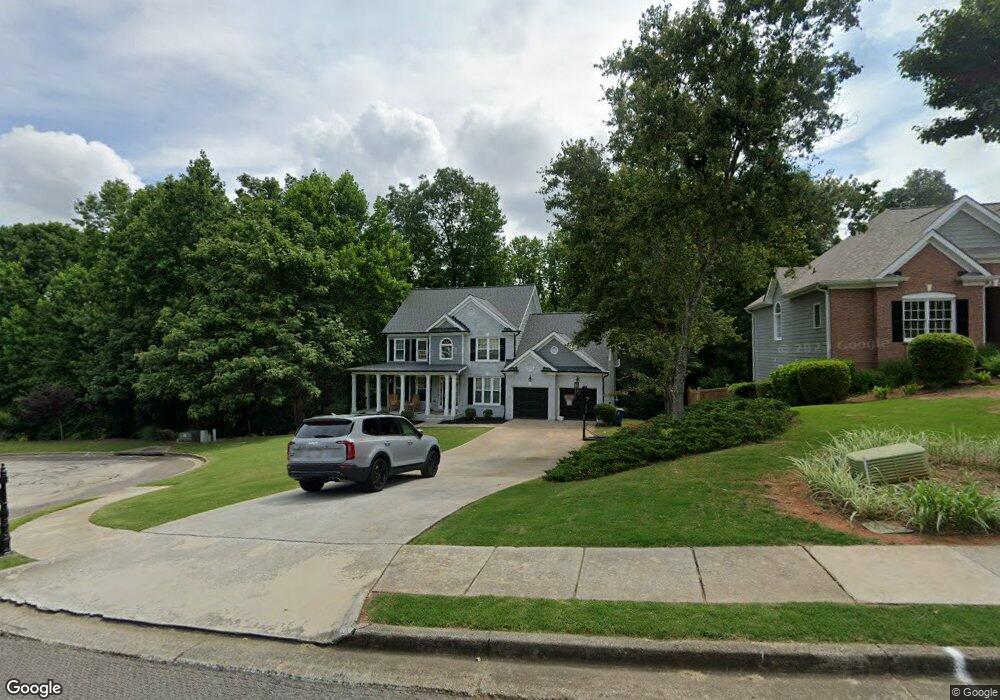
1143 Cayuga Ct Dacula, GA 30019
Estimated Value: $541,526 - $555,000
5
Beds
3
Baths
2,636
Sq Ft
$208/Sq Ft
Est. Value
About This Home
This home is located at 1143 Cayuga Ct, Dacula, GA 30019 and is currently estimated at $548,632, approximately $208 per square foot. 1143 Cayuga Ct is a home located in Gwinnett County with nearby schools including Mulberry Elementary School, Dacula Middle School, and Dacula High School.
Ownership History
Date
Name
Owned For
Owner Type
Purchase Details
Closed on
Feb 20, 2025
Sold by
Cason Kristian D
Bought by
Malloy Rashemah
Current Estimated Value
Home Financials for this Owner
Home Financials are based on the most recent Mortgage that was taken out on this home.
Original Mortgage
$488,250
Outstanding Balance
$484,109
Interest Rate
6.96%
Mortgage Type
New Conventional
Estimated Equity
$64,523
Purchase Details
Closed on
May 1, 2020
Sold by
Reynolds Iara F
Bought by
Burgamy Kristian D
Home Financials for this Owner
Home Financials are based on the most recent Mortgage that was taken out on this home.
Original Mortgage
$308,900
Interest Rate
3.3%
Mortgage Type
New Conventional
Purchase Details
Closed on
Oct 7, 2011
Sold by
The Bank Of New York Mello
Bought by
Reynolds John T and Reynolds Lara F
Home Financials for this Owner
Home Financials are based on the most recent Mortgage that was taken out on this home.
Original Mortgage
$142,500
Interest Rate
4.2%
Mortgage Type
New Conventional
Purchase Details
Closed on
Dec 7, 2010
Sold by
Morgan Thomas A
Bought by
Bank Of Ny Series 2004-6
Purchase Details
Closed on
Mar 26, 2004
Sold by
Morgan Thomas A
Bought by
Morgan Thomas A and Morgan Wendy
Home Financials for this Owner
Home Financials are based on the most recent Mortgage that was taken out on this home.
Original Mortgage
$179,100
Interest Rate
5.25%
Mortgage Type
New Conventional
Create a Home Valuation Report for This Property
The Home Valuation Report is an in-depth analysis detailing your home's value as well as a comparison with similar homes in the area
Home Values in the Area
Average Home Value in this Area
Purchase History
| Date | Buyer | Sale Price | Title Company |
|---|---|---|---|
| Malloy Rashemah | $542,500 | -- | |
| Burgamy Kristian D | $318,500 | -- | |
| Reynolds John T | $150,000 | -- | |
| Bank Of Ny Series 2004-6 | -- | -- | |
| Morgan Thomas A | -- | -- | |
| Morgan Thomas A | $223,900 | -- |
Source: Public Records
Mortgage History
| Date | Status | Borrower | Loan Amount |
|---|---|---|---|
| Open | Malloy Rashemah | $488,250 | |
| Previous Owner | Burgamy Kristian D | $308,900 | |
| Previous Owner | Reynolds John T | $142,500 | |
| Previous Owner | Morgan Thomas A | $179,100 | |
| Previous Owner | Morgan Thomas A | $44,800 |
Source: Public Records
Tax History
| Year | Tax Paid | Tax Assessment Tax Assessment Total Assessment is a certain percentage of the fair market value that is determined by local assessors to be the total taxable value of land and additions on the property. | Land | Improvement |
|---|---|---|---|---|
| 2025 | $5,737 | $193,040 | $38,120 | $154,920 |
| 2024 | $5,701 | $182,240 | $37,600 | $144,640 |
| 2023 | $5,701 | $182,240 | $37,600 | $144,640 |
| 2022 | $5,291 | $164,760 | $32,000 | $132,760 |
| 2021 | $4,482 | $122,880 | $24,800 | $98,080 |
| 2020 | $4,323 | $114,240 | $20,000 | $94,240 |
| 2019 | $4,167 | $114,240 | $20,000 | $94,240 |
| 2018 | $3,885 | $106,040 | $20,000 | $86,040 |
| 2016 | $3,633 | $98,280 | $16,000 | $82,280 |
| 2015 | $3,193 | $84,920 | $16,000 | $68,920 |
| 2014 | $2,997 | $78,960 | $14,000 | $64,960 |
Source: Public Records
Map
Nearby Homes
- 1255 Chippewa Oak Dr NE
- 990 Mulberry Bay Dr
- 956 Chippewa Oak Dr
- 946 Chippewa Oak Dr NE
- 3204 Woodwind Ln
- 3399 In Bloom Way
- 3265 Thimbleberry Trail
- 1040 Auburn Rd
- 968 Hilltop Park Ct
- 1274 Six Sisters St
- 1084 Scarlet Sage Cir
- 1175 Scarlet Sage Cir
- 3478 In Bloom Way
- 969 Hilltop Park Ct
- 1693 Caldwell Bend Ln
- 3499 In Bloom Way
- 718 Bartow Dr
- 3067 Hudson Glen Way
- 1663 Caldwell Bend Ln
- 3070 Hudson Glen Way
- 1113 Cayuga Ct
- 1152 Cayuga Ct
- 1152 Cayuga Ct Unit I
- 1152 Cayuga Ct Unit 80
- 3210 Flat Bottom Dr NE
- 3210 Flatbottom Dr
- 1142 Cayuga Ct
- 1103 Cayuga Ct
- 1132 Cayuga Ct
- 1112 Cayuga Ct
- 1102 Cayuga Ct
- 1255 Chippewa Oak Dr
- 1255 Chippewa Oak Dr Unit 1
- 1135 Chippewa Oak Dr
- 3225 Flatbottom Dr
- 1145 Chippewa Oak Dr
- 1265 Chippewa Oak Dr
- 1125 Chippewa Oak Dr
- 1155 Chippewa Oak Dr
- 1275 Chippewa Oak Dr
Your Personal Tour Guide
Ask me questions while you tour the home.