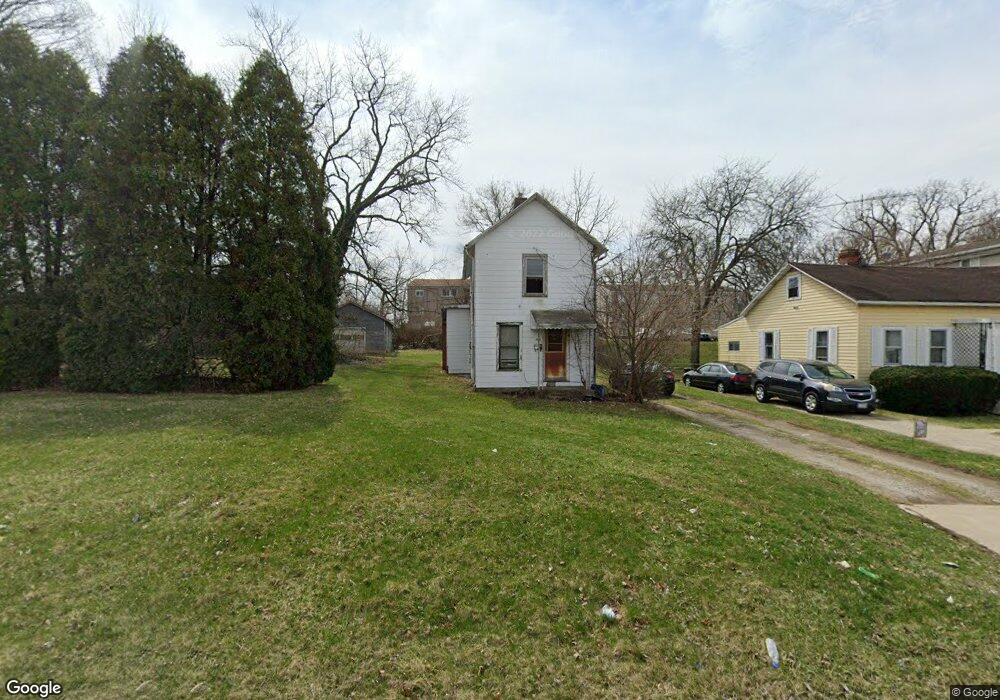
1143 E John St Springfield, OH 45505
Estimated Value: $89,000
2
Beds
1
Bath
1,072
Sq Ft
$83/Sq Ft
Est. Value
About This Home
This home is located at 1143 E John St, Springfield, OH 45505 and is currently priced at $89,000, approximately $83 per square foot. 1143 E John St is a home located in Clark County with nearby schools including Kenwood Elementary School, Hayward Middle School, and Springfield High School.
Ownership History
Date
Name
Owned For
Owner Type
Purchase Details
Closed on
Aug 15, 2019
Sold by
The Springfield Ohiio Apartments Llc
Bought by
Springfield Portfolio Realty Llc
Current Estimated Value
Purchase Details
Closed on
Jan 31, 2005
Sold by
Stout William R and Stout Debra R
Bought by
Cornerstone Apartment Communities Ltd
Home Financials for this Owner
Home Financials are based on the most recent Mortgage that was taken out on this home.
Original Mortgage
$2,012,150
Interest Rate
5.83%
Mortgage Type
Purchase Money Mortgage
Purchase Details
Closed on
Jul 24, 1996
Sold by
Parks Ruth J
Bought by
Stacy William D and Stacy Patricia S
Home Financials for this Owner
Home Financials are based on the most recent Mortgage that was taken out on this home.
Original Mortgage
$24,000
Interest Rate
8.43%
Mortgage Type
New Conventional
Create a Home Valuation Report for This Property
The Home Valuation Report is an in-depth analysis detailing your home's value as well as a comparison with similar homes in the area
Home Values in the Area
Average Home Value in this Area
Purchase History
| Date | Buyer | Sale Price | Title Company |
|---|---|---|---|
| Springfield Portfolio Realty Llc | -- | Riverside Abstract Llc | |
| The Springfield Ohio Apartments Llc | -- | Riverside Abstract Llc | |
| Cornerstone Apartment Communities Ltd | $125,000 | -- | |
| Stout William R | $100,000 | -- | |
| Stacy William D | $33,000 | -- |
Source: Public Records
Mortgage History
| Date | Status | Borrower | Loan Amount |
|---|---|---|---|
| Previous Owner | Stout William R | $2,012,150 | |
| Previous Owner | Cornerstone Apartment Communities Ltd | $125,000 | |
| Previous Owner | Stacy William D | $24,000 |
Source: Public Records
Tax History
| Year | Tax Paid | Tax Assessment Tax Assessment Total Assessment is a certain percentage of the fair market value that is determined by local assessors to be the total taxable value of land and additions on the property. | Land | Improvement |
|---|---|---|---|---|
| 2020 | $551 | $0 | $0 | $0 |
| 2019 | -- | $16,440 | $5,680 | $10,760 |
| 2018 | -- | $18,760 | $7,110 | $11,650 |
| 2017 | -- | $18,757 | $7,105 | $11,652 |
| 2016 | -- | $18,757 | $7,105 | $11,652 |
| 2015 | -- | $18,757 | $7,105 | $11,652 |
| 2014 | -- | $18,757 | $7,105 | $11,652 |
| 2013 | -- | $18,757 | $7,105 | $11,652 |
Source: Public Records
Map
Nearby Homes
- 1440 Selma Rd
- 1846 Ohio Ave
- 1247 Selma Rd
- 1716 N Sweetbriar Ln
- 1806 N Sweetbriar Ln
- 1820 Clay St
- 1519 Tibbetts Ave
- 1213 Gable St
- 1724 Clay St
- 1823 Clay St
- 1111 Lafayette Ave
- 550 E Rose St
- 1225 Beacon St
- 652 E Southern Ave
- 1823 Rutland Ave
- 908 Pine St
- 1318 Maryland Ave
- 2108 Sunset Ave
- 1008 Tibbetts Ave
- 1652 Kenton St
- 1137 E John St
- 1105-1213 E John St
- 1200 E John St
- 1204 E John St
- 1133 E John St
- 1208 E John St
- 1120 E John St
- 1110 E John St Unit 1138
- 1110 E John St
- 1038 E John St
- 1101 E John St
- 1661 Selma Rd
- 1020 E John St Unit 1024
- 10 Acres Selma Rd
- 16 Acres Selma Rd
- 11 Acres Selma Rd
- 1209 Sunset Ave
- 1209 Sunset Ave
- 1746 Selma Rd
- 1670 Selma Rd
Your Personal Tour Guide
Ask me questions while you tour the home.