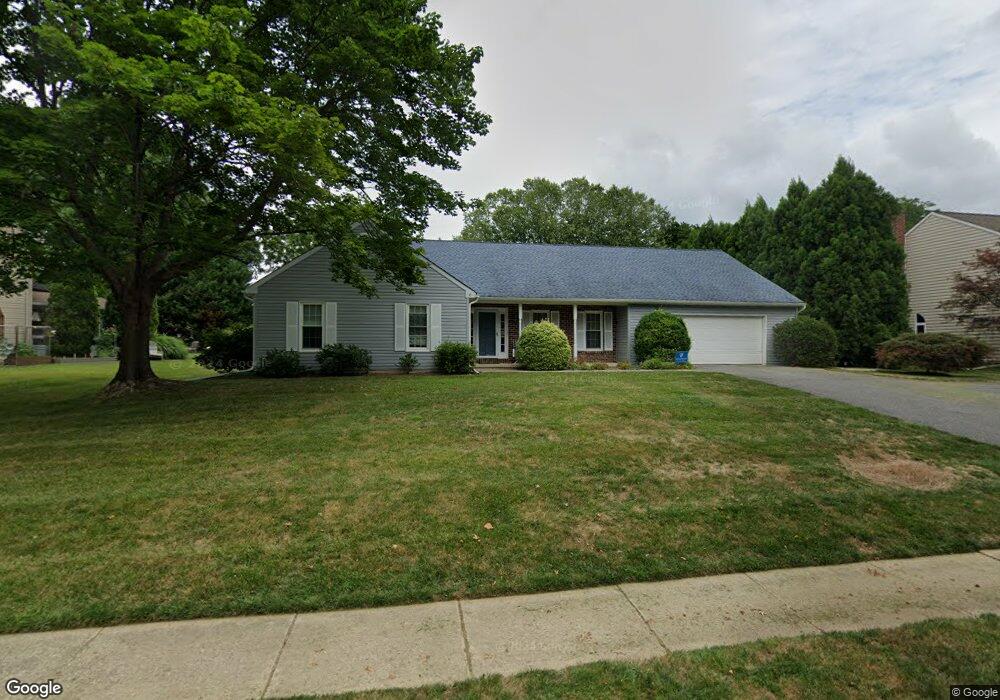
1143 Fielding Dr West Chester, PA 19382
Estimated Value: $653,000 - $782,000
3
Beds
2
Baths
1,976
Sq Ft
$360/Sq Ft
Est. Value
About This Home
This home is located at 1143 Fielding Dr, West Chester, PA 19382 and is currently estimated at $710,799, approximately $359 per square foot. 1143 Fielding Dr is a home located in Chester County with nearby schools including Sarah W Starkweather Elementary School, Stetson Middle School, and Bayard Rustin High School.
Ownership History
Date
Name
Owned For
Owner Type
Purchase Details
Closed on
Jul 18, 2025
Sold by
Miller Michael and Miller Florence
Bought by
Wilsey Steven and Wilsey Angela
Current Estimated Value
Home Financials for this Owner
Home Financials are based on the most recent Mortgage that was taken out on this home.
Original Mortgage
$486,500
Outstanding Balance
$483,137
Interest Rate
5.97%
Mortgage Type
New Conventional
Estimated Equity
$227,662
Purchase Details
Closed on
Sep 14, 1999
Sold by
Homan John F and Homan Irene
Bought by
Bratun Christopher and Hill Bratun Tammi
Home Financials for this Owner
Home Financials are based on the most recent Mortgage that was taken out on this home.
Original Mortgage
$223,100
Interest Rate
7.83%
Create a Home Valuation Report for This Property
The Home Valuation Report is an in-depth analysis detailing your home's value as well as a comparison with similar homes in the area
Home Values in the Area
Average Home Value in this Area
Purchase History
| Date | Buyer | Sale Price | Title Company |
|---|---|---|---|
| Wilsey Steven | $725,000 | Brandywine Abstract | |
| Wilsey Steven | $725,000 | Brandywine Abstract | |
| Bratun Christopher | $230,000 | Fidelity National Title |
Source: Public Records
Mortgage History
| Date | Status | Borrower | Loan Amount |
|---|---|---|---|
| Open | Wilsey Steven | $486,500 | |
| Closed | Wilsey Steven | $486,500 | |
| Previous Owner | Bratun Christopher | $223,100 |
Source: Public Records
Tax History Compared to Growth
Tax History
| Year | Tax Paid | Tax Assessment Tax Assessment Total Assessment is a certain percentage of the fair market value that is determined by local assessors to be the total taxable value of land and additions on the property. | Land | Improvement |
|---|---|---|---|---|
| 2025 | $6,036 | $195,300 | $52,360 | $142,940 |
| 2024 | $6,036 | $195,300 | $52,360 | $142,940 |
| 2023 | $5,995 | $195,300 | $52,360 | $142,940 |
| 2022 | $5,881 | $195,300 | $52,360 | $142,940 |
| 2021 | $5,803 | $195,300 | $52,360 | $142,940 |
| 2020 | $5,767 | $195,300 | $52,360 | $142,940 |
| 2019 | $5,691 | $195,300 | $52,360 | $142,940 |
| 2018 | $5,576 | $195,300 | $52,360 | $142,940 |
| 2017 | $5,462 | $195,300 | $52,360 | $142,940 |
| 2016 | $4,221 | $195,300 | $52,360 | $142,940 |
| 2015 | $4,221 | $195,300 | $52,360 | $142,940 |
| 2014 | $4,221 | $195,300 | $52,360 | $142,940 |
Source: Public Records
Map
Nearby Homes
- 123 E Street Rd
- 1075 Westwood Dr
- 600 Oaklea Ln
- 111 Gilpin Dr
- 120 Gilpin Dr
- 231 Caleb Dr Unit 21
- 1261 Buck Ln
- 7 S Garden Cir
- 7 Garden Cir
- 102 Cheyney Dr
- 501 W Street Rd
- 1252 Northgate Rd
- 1015 Adams Way
- 602 John Anthony Dr
- 671 Casey Ln
- 1119 S New St
- 202 Larchwood Rd
- 1549 S Coventry Ln
- 924 Trellis Ln
- 300 Greenbriar Dr
- 1145 Fielding Dr
- 200 Piedmont Rd
- 203 Swinburne Rd
- 202 Piedmont Rd
- 1147 Fielding Dr
- 1142 Fielding Dr
- 116 Piedmont Rd
- 1144 Fielding Dr
- 202 Swinburne Rd
- 205 Swinburne Rd
- 1149 Fielding Dr
- 1146 Fielding Dr
- 206 Piedmont Rd
- 203 Piedmont Rd
- 201 Piedmont Rd
- 207 Swinburne Rd
- 114 Piedmont Rd
- 204 Swinburne Rd
- 205 Piedmont Rd
- 1151 Fielding Dr