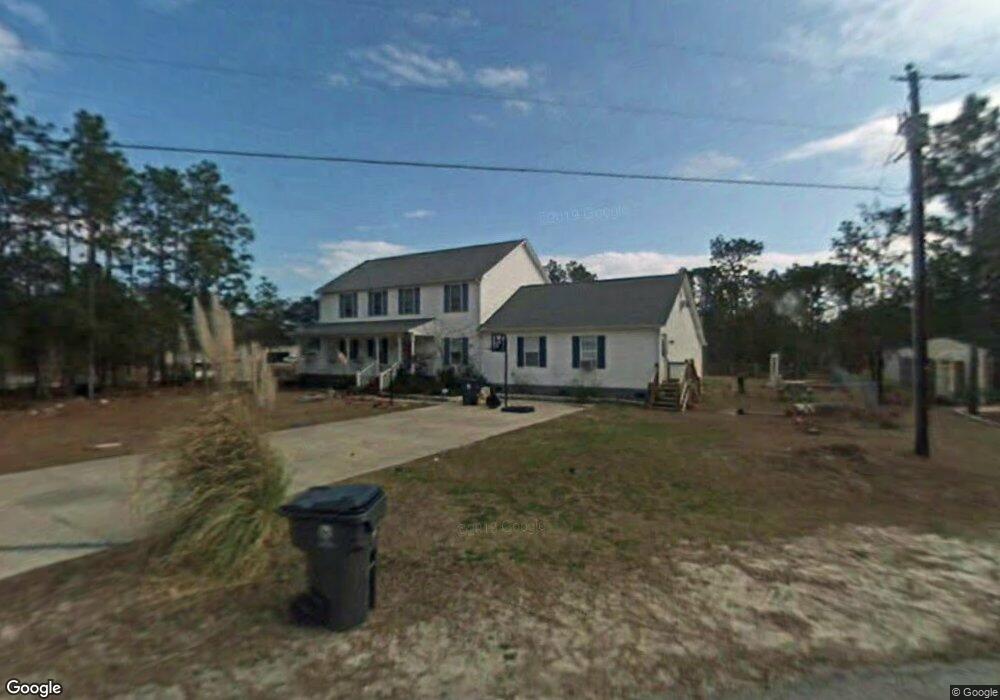
1143 Grant Cir Southport, NC 28461
Estimated Value: $393,208 - $510,000
4
Beds
3
Baths
2,436
Sq Ft
$186/Sq Ft
Est. Value
About This Home
This home is located at 1143 Grant Cir, Southport, NC 28461 and is currently estimated at $452,802, approximately $185 per square foot. 1143 Grant Cir is a home located in Brunswick County with nearby schools including Bolivia Elementary School, South Brunswick Middle School, and South Brunswick High School.
Ownership History
Date
Name
Owned For
Owner Type
Purchase Details
Closed on
Sep 21, 2022
Sold by
Alexander Peter J and Alexander Frances M
Bought by
Alexander Peter J and Alexander Frances M
Current Estimated Value
Home Financials for this Owner
Home Financials are based on the most recent Mortgage that was taken out on this home.
Original Mortgage
$155,000
Outstanding Balance
$144,914
Interest Rate
5.55%
Mortgage Type
New Conventional
Estimated Equity
$307,888
Purchase Details
Closed on
Dec 5, 2011
Sold by
Suntrust Bank
Bought by
Alexander Timothy J and Alexander Margaret A
Purchase Details
Closed on
Apr 30, 2010
Sold by
Howard Christopher and Howard Shandi
Bought by
Suntrust Bank
Purchase Details
Closed on
Jun 30, 2009
Sold by
Howard Christopher N and Howard Shandi M
Bought by
Suntrust Bank
Create a Home Valuation Report for This Property
The Home Valuation Report is an in-depth analysis detailing your home's value as well as a comparison with similar homes in the area
Home Values in the Area
Average Home Value in this Area
Purchase History
| Date | Buyer | Sale Price | Title Company |
|---|---|---|---|
| Alexander Peter J | -- | None Listed On Document | |
| Alexander Peter J | -- | None Listed On Document | |
| Alexander Timothy J | $114,000 | None Available | |
| Suntrust Bank | $20,000 | None Available | |
| Suntrust Bank | $275,500 | None Available |
Source: Public Records
Mortgage History
| Date | Status | Borrower | Loan Amount |
|---|---|---|---|
| Open | Alexander Peter J | $155,000 | |
| Closed | Alexander Peter J | $155,000 |
Source: Public Records
Tax History Compared to Growth
Tax History
| Year | Tax Paid | Tax Assessment Tax Assessment Total Assessment is a certain percentage of the fair market value that is determined by local assessors to be the total taxable value of land and additions on the property. | Land | Improvement |
|---|---|---|---|---|
| 2025 | $2,412 | $378,230 | $35,250 | $342,980 |
| 2024 | $2,412 | $378,230 | $35,250 | $342,980 |
| 2023 | $2,505 | $378,230 | $35,250 | $342,980 |
| 2022 | $2,478 | $287,160 | $9,000 | $278,160 |
| 2021 | $2,478 | $287,160 | $9,000 | $278,160 |
| 2020 | $2,328 | $287,160 | $9,000 | $278,160 |
| 2019 | $2,289 | $29,320 | $9,000 | $20,320 |
| 2018 | $2,047 | $34,520 | $10,000 | $24,520 |
| 2017 | $1,997 | $34,520 | $10,000 | $24,520 |
| 2016 | $1,947 | $34,520 | $10,000 | $24,520 |
| 2015 | $1,947 | $251,380 | $10,000 | $241,380 |
| 2014 | $1,754 | $253,749 | $25,000 | $228,749 |
Source: Public Records
Map
Nearby Homes
- 1180 Filmore Rd
- 1190 Filmore Rd
- 1101 Buchanan Rd
- 1070 Grant Cir
- 1191 Filmore Rd
- 5 Monroe Rd
- 1060 Springdale Rd
- 560 Kennedy Cir
- 1030 Fillmore St
- 550 Kennedy Cir
- 1281 Jefferson Rd
- Lot 4 Jefferson Rd
- 1053 Springdale Rd
- 130 Charlestown Rd
- 1281 Washington Rd
- 1121 Beaufort Rd
- Lot 81 Trevino Rd
- 721 Trevino Rd
- 949 Fifty Lakes Dr
- 998 Trevino Rd
- 1141&1149 18 & 19 Buchanan Rd
- 1141&1149 Buchanan
- 2 Buchanan Rd
- 0 Buchanan Rd
- 205 Buchanan Rd
- 1151 Pierce Rd
- 1125 Buchanan Rd
- 1165 Buchanan Rd
- 1165 Buchanan Rd Unit Bsl
- 1140 Grant Cir
- 1117 Buchanan Rd
- 1171 Pierce Rd
- 1181 Pierce Rd
- 1131 Grant Cir
- L-1 Buchanan
- 1160 Pierce Rd
- 1191 Buchanan Rd
- 1100 Grant Cir
- 1116 Fillmore St
- 1124 Fillmore St