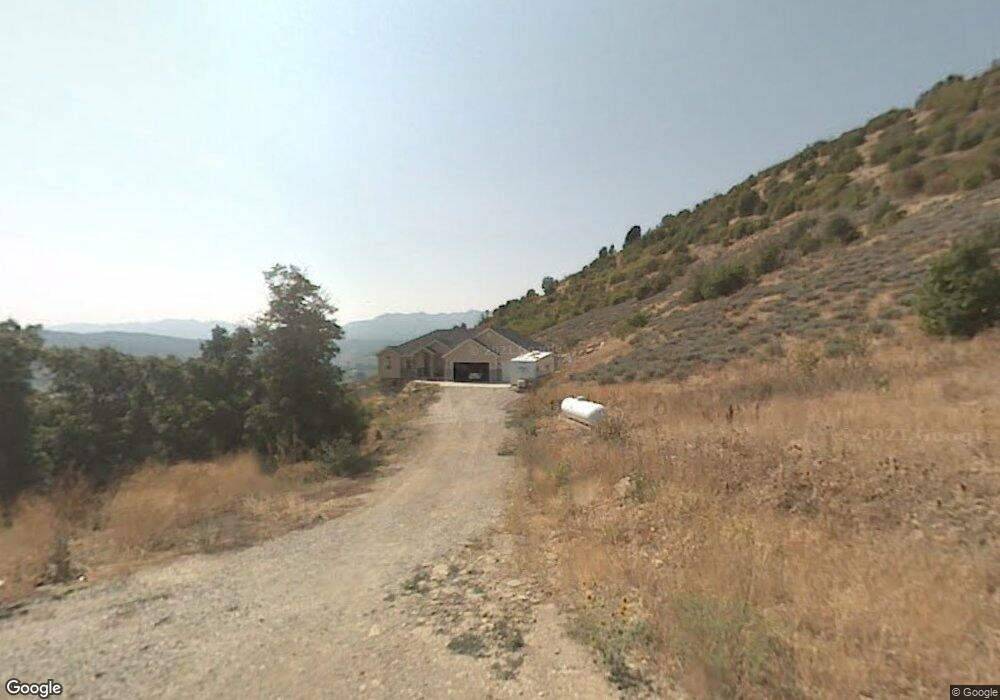
1143 Maple Dr Huntsville, UT 84317
Estimated Value: $1,127,000 - $1,624,000
3
Beds
3
Baths
3,775
Sq Ft
$340/Sq Ft
Est. Value
About This Home
This home is located at 1143 Maple Dr, Huntsville, UT 84317 and is currently estimated at $1,282,970, approximately $339 per square foot. 1143 Maple Dr is a home located in Weber County with nearby schools including Valley Elementary School, Snowcrest Junior High School, and Weber High School.
Ownership History
Date
Name
Owned For
Owner Type
Purchase Details
Closed on
Jan 16, 2014
Sold by
Vandemyle Jason and Vandemyle Anna
Bought by
Kushlan Talitha
Current Estimated Value
Purchase Details
Closed on
Jul 20, 2005
Sold by
Eborn Harold P
Bought by
Vandemyle Jason and Vandemyle Anna
Home Financials for this Owner
Home Financials are based on the most recent Mortgage that was taken out on this home.
Original Mortgage
$337,377
Interest Rate
5.46%
Mortgage Type
Purchase Money Mortgage
Purchase Details
Closed on
Jan 7, 1999
Sold by
Mountain View Title and Aland James
Bought by
Eborn Harold P
Create a Home Valuation Report for This Property
The Home Valuation Report is an in-depth analysis detailing your home's value as well as a comparison with similar homes in the area
Home Values in the Area
Average Home Value in this Area
Purchase History
| Date | Buyer | Sale Price | Title Company |
|---|---|---|---|
| Kushlan Talitha | $264,301 | Etitle Insurance Agency | |
| Vandemyle Jason | -- | Bonneville Title Company Sal | |
| Eborn Harold P | -- | Mountain View Title |
Source: Public Records
Mortgage History
| Date | Status | Borrower | Loan Amount |
|---|---|---|---|
| Previous Owner | Vandemyle Jason | $337,377 |
Source: Public Records
Tax History Compared to Growth
Tax History
| Year | Tax Paid | Tax Assessment Tax Assessment Total Assessment is a certain percentage of the fair market value that is determined by local assessors to be the total taxable value of land and additions on the property. | Land | Improvement |
|---|---|---|---|---|
| 2025 | $5,002 | $998,908 | $297,575 | $701,333 |
| 2024 | $5,002 | $529,933 | $176,050 | $353,883 |
| 2023 | $4,435 | $461,437 | $174,330 | $287,107 |
| 2022 | $4,529 | $468,469 | $135,192 | $333,277 |
| 2021 | $4,015 | $696,985 | $185,840 | $511,145 |
| 2020 | $3,543 | $560,513 | $145,835 | $414,678 |
| 2019 | $3,590 | $543,000 | $125,832 | $417,168 |
| 2018 | $3,735 | $541,961 | $125,832 | $416,129 |
| 2017 | $3,537 | $504,144 | $135,800 | $368,344 |
| 2016 | $3,559 | $286,990 | $86,300 | $200,690 |
| 2015 | $3,543 | $282,774 | $75,300 | $207,474 |
| 2014 | $3,117 | $242,996 | $69,800 | $173,196 |
Source: Public Records
Map
Nearby Homes
- 1331 N Maple Dr Unit 99
- 8927 Pineview Dr
- 9658 E Kelley Dr Unit 65
- 409 N 9000 E
- 9783 E Highway 39
- 241 S 8600 E
- 8307 Utah 39
- 8842 E 500 S
- 8817 Mountain Valley Dr
- 7379 E Sky Ranch Rd Unit 5
- 7461 E Sky Ranch Rd
- 7461 E Sky Ranch Rd Unit 4
- 8822 E Eagle Way St Unit 7
- 4400 Plan at Sage - SAGE
- 4200 Plan at Sage - SAGE
- 3500 Plan at Sage - SAGE
- 7643 E 500 S
- 484 S 7900 E Unit 9
- 335 S 7900 E Unit 15
- 423 S 7900 E Unit 12
- 1143 Maple Dr
- 1143 Maple Dr Unit 94
- 1115 Maple Dr
- 1115 Maple Dr Unit 93
- 1115 Maple Dr Unit 93
- 1115 Maple Dr Unit 93
- 1156 N Maple Dr Unit 104
- 1156 N Maple Dr Unit 105
- 1168 Maple Dr
- 1168 Maple Dr Unit 95
- 1156 Maple Dr
- 1088 Maple Dr
- 1088 Maple Dr Unit 107
- 1088 Maple Dr
- 1100 Maple Dr
- 1100 Maple Dr
- 1100 Maple Dr Unit 106
- 1176 N Maple St
- 1176 N Maple St Unit 118
- 1176 Maple Dr