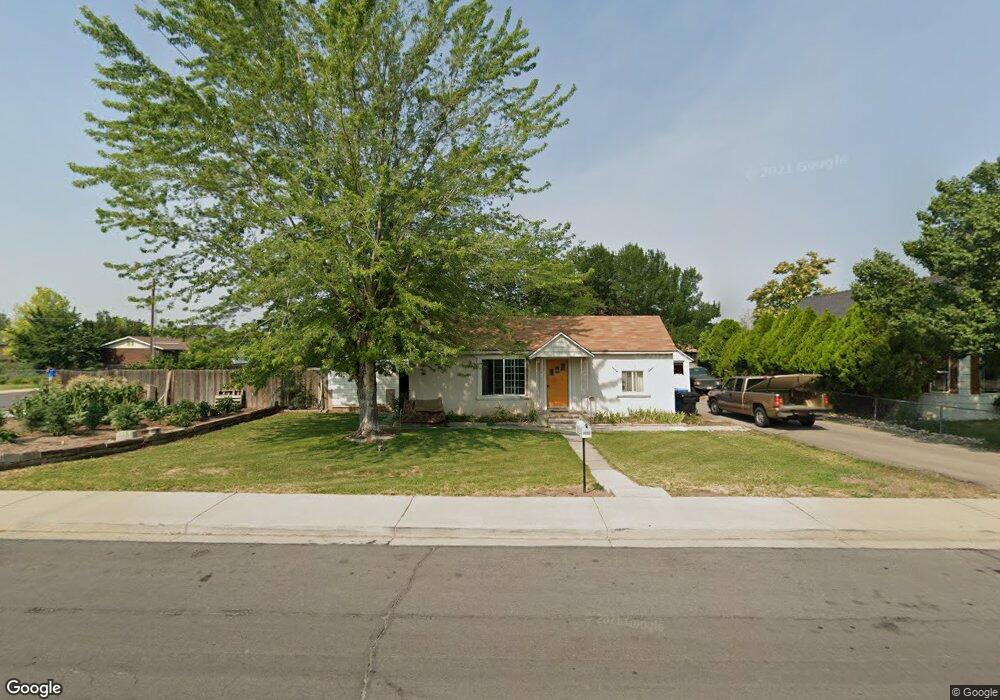
1143 N 200 E Orem, UT 84057
Windsor NeighborhoodEstimated Value: $434,000 - $469,307
2
Beds
2
Baths
1,372
Sq Ft
$329/Sq Ft
Est. Value
About This Home
This home is located at 1143 N 200 E, Orem, UT 84057 and is currently estimated at $451,769, approximately $329 per square foot. 1143 N 200 E is a home located in Utah County with nearby schools including Windsor School, Canyon View Junior High School, and Timpanogos High School.
Ownership History
Date
Name
Owned For
Owner Type
Purchase Details
Closed on
May 16, 2024
Sold by
Lows J Chatterley Trust and Chatterley Louis Matthew
Bought by
Chatterley Jeffrey John
Current Estimated Value
Purchase Details
Closed on
May 1, 2024
Sold by
Chatterley Louis J
Bought by
Chatterley Jeffrey John
Purchase Details
Closed on
Jul 9, 2008
Sold by
Pena Rafael Amador
Bought by
Salmond Wayne R
Purchase Details
Closed on
Mar 28, 2003
Sold by
Colledge Lyle W and Colledge Stephen Ray
Bought by
Pena Rafael Amador
Create a Home Valuation Report for This Property
The Home Valuation Report is an in-depth analysis detailing your home's value as well as a comparison with similar homes in the area
Home Values in the Area
Average Home Value in this Area
Purchase History
| Date | Buyer | Sale Price | Title Company |
|---|---|---|---|
| Chatterley Jeffrey John | -- | Inwest Title | |
| Chatterley Jeffrey John | -- | None Listed On Document | |
| Salmond Wayne R | -- | First American Lindon | |
| Pena Rafael Amador | -- | First American Title Co |
Source: Public Records
Tax History
| Year | Tax Paid | Tax Assessment Tax Assessment Total Assessment is a certain percentage of the fair market value that is determined by local assessors to be the total taxable value of land and additions on the property. | Land | Improvement |
|---|---|---|---|---|
| 2025 | $1,784 | $233,310 | -- | -- |
| 2024 | $1,784 | $218,130 | $0 | $0 |
| 2023 | $1,618 | $212,630 | $0 | $0 |
| 2022 | $1,763 | $224,455 | $0 | $0 |
| 2021 | $1,429 | $275,500 | $152,400 | $123,100 |
| 2020 | $1,280 | $242,600 | $121,900 | $120,700 |
| 2019 | $1,128 | $222,400 | $110,400 | $112,000 |
| 2018 | $1,083 | $204,000 | $106,600 | $97,400 |
| 2017 | $1,009 | $101,750 | $0 | $0 |
| 2016 | $954 | $88,770 | $0 | $0 |
| 2015 | $913 | $80,300 | $0 | $0 |
| 2014 | $900 | $78,815 | $0 | $0 |
Source: Public Records
Map
Nearby Homes
- 1111 N 150 W
- 287 W 1380 N
- 125 W 870 N
- 16 E 925 N
- 332 W Amiron Way Unit D
- 538 W 1120 N
- 1461 N Amiron Way Unit B
- 1244 N 580 W
- 531 W 1350 N
- 917 N Garden Dr
- 582 W 1300 N
- 1566 N 275 West St Unit 1
- 512 W 1450 N
- 1547 N 275 West St Unit 5
- 1545 N State St Unit 1
- 1371 N 330 E Unit 8
- 789 200 E Unit 787
- 597 N State St Unit 25
- 372 E 1165 N
- 363 E 1395 N Unit 22
Your Personal Tour Guide
Ask me questions while you tour the home.