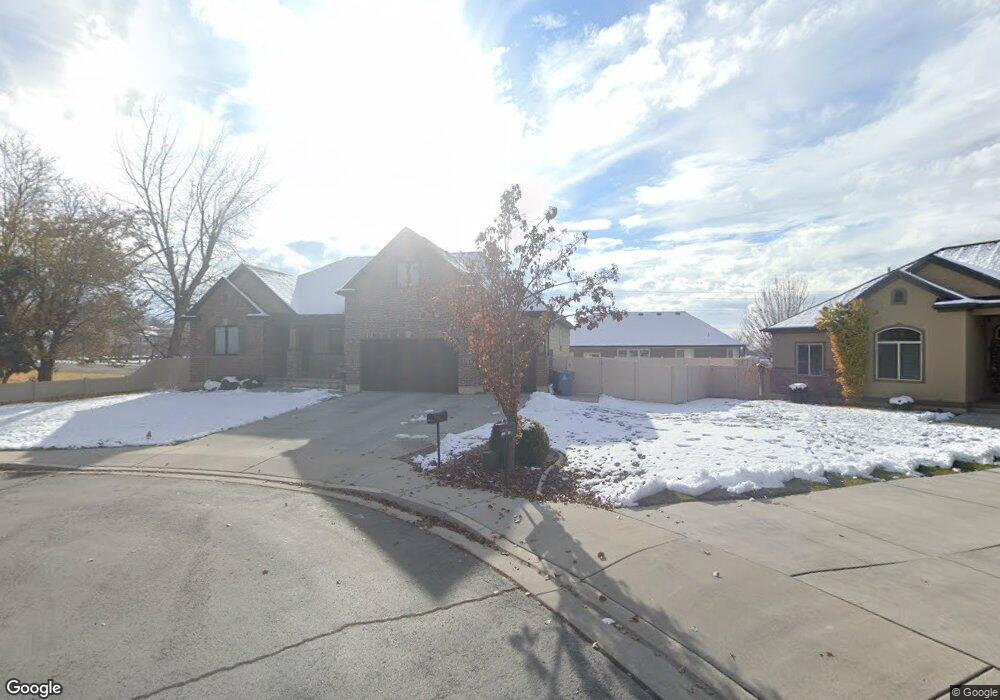
1143 N 220 E Pleasant Grove, UT 84062
Estimated Value: $622,000 - $842,661
3
Beds
4
Baths
2,291
Sq Ft
$326/Sq Ft
Est. Value
About This Home
This home is located at 1143 N 220 E, Pleasant Grove, UT 84062 and is currently estimated at $746,915, approximately $326 per square foot. 1143 N 220 E is a home with nearby schools including Grovecrest Elementary School, Pleasant Grove Junior High School, and Pleasant Grove High School.
Ownership History
Date
Name
Owned For
Owner Type
Purchase Details
Closed on
May 30, 2012
Sold by
Tracy Ron M
Bought by
Tracy Ron M and Tracy Sharla Nichole
Current Estimated Value
Home Financials for this Owner
Home Financials are based on the most recent Mortgage that was taken out on this home.
Original Mortgage
$298,889
Outstanding Balance
$203,906
Interest Rate
3.5%
Mortgage Type
FHA
Estimated Equity
$543,009
Purchase Details
Closed on
May 29, 2012
Sold by
Richmond American Homes Of Utah Inc
Bought by
Tracy Ron M
Home Financials for this Owner
Home Financials are based on the most recent Mortgage that was taken out on this home.
Original Mortgage
$298,889
Outstanding Balance
$203,906
Interest Rate
3.5%
Mortgage Type
FHA
Estimated Equity
$543,009
Purchase Details
Closed on
Feb 28, 2011
Sold by
Gy Larsen Acres Llc
Bought by
Richmond American Homes Of Utah Inc
Purchase Details
Closed on
Apr 26, 2007
Sold by
Larsen Estates Llc
Bought by
Gy Larsen Acres Llc
Create a Home Valuation Report for This Property
The Home Valuation Report is an in-depth analysis detailing your home's value as well as a comparison with similar homes in the area
Home Values in the Area
Average Home Value in this Area
Purchase History
| Date | Buyer | Sale Price | Title Company |
|---|---|---|---|
| Tracy Ron M | -- | First American Title Co | |
| Tracy Ron M | -- | First American Title Co Llc | |
| Richmond American Homes Of Utah Inc | -- | First American Union Heig | |
| Gy Larsen Acres Llc | -- | Backman |
Source: Public Records
Mortgage History
| Date | Status | Borrower | Loan Amount |
|---|---|---|---|
| Open | Tracy Ron M | $298,889 |
Source: Public Records
Tax History Compared to Growth
Tax History
| Year | Tax Paid | Tax Assessment Tax Assessment Total Assessment is a certain percentage of the fair market value that is determined by local assessors to be the total taxable value of land and additions on the property. | Land | Improvement |
|---|---|---|---|---|
| 2025 | $3,543 | $446,930 | $298,000 | $514,600 |
| 2024 | $3,543 | $422,895 | $0 | $0 |
| 2023 | $3,472 | $424,215 | $0 | $0 |
| 2022 | $3,755 | $456,500 | $0 | $0 |
| 2021 | $2,847 | $527,000 | $175,000 | $352,000 |
| 2020 | $2,706 | $491,000 | $162,000 | $329,000 |
| 2019 | $2,329 | $437,100 | $151,000 | $286,100 |
| 2018 | $2,342 | $415,600 | $147,300 | $268,300 |
| 2017 | $2,332 | $220,330 | $0 | $0 |
| 2016 | $2,416 | $220,330 | $0 | $0 |
| 2015 | $2,551 | $220,330 | $0 | $0 |
| 2014 | $2,457 | $210,210 | $0 | $0 |
Source: Public Records
Map
Nearby Homes
- 344 E 900 N
- 825 N 350 E
- 1152 N 200 W
- 540 E 990 N
- 429 E 1600 N
- 1656 N Siena Cir Unit 7
- 1726 N Siena Cir Unit 10
- 1727 N Siena Cir Unit 4
- 405 N 200 E
- 641 E 700 N
- 575 E 500 N
- 1192 N 730 E
- 1051 N 600 W
- 1031 N 600 W
- 1041 N 600 W
- 146 N 200 E
- 685 W 1000 N
- 525 E 200 N
- 731 W 1590 N Unit 15
- 1534 N 750 W Unit 16
- 1163 N 220 E
- 221 E 1100 N Unit 2
- 221 E 1100 N
- 265 E 1100 N
- 1175 N 220 E Unit 5
- 1175 N 220 E
- 193 E 1100 N
- 193 E 1100 N Unit 1
- 1188 N 220 E
- 1185 N 250 E
- 1187 N 220 E Unit 6
- 1187 N 220 E
- 1144 N 170 E
- 1144 N 170 E Unit 35
- 1116 N 170 E
- 1154 N 250 E
- 1174 N 170 E
- 1212 N 220 E
- 1209 N 250 E Unit 17
- 1209 N 250 E