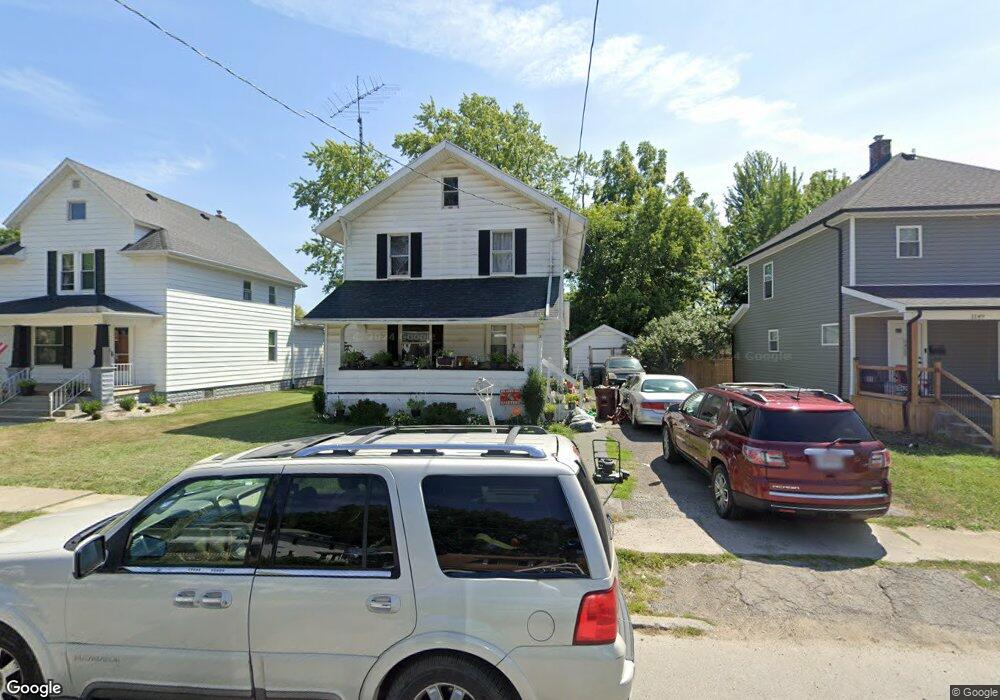
1143 Richie Ave Lima, OH 45805
Central Lima NeighborhoodEstimated Value: $61,000 - $98,469
3
Beds
2
Baths
1,434
Sq Ft
$60/Sq Ft
Est. Value
About This Home
This home is located at 1143 Richie Ave, Lima, OH 45805 and is currently estimated at $85,617, approximately $59 per square foot. 1143 Richie Ave is a home located in Allen County with nearby schools including Heritage Elementary School, Lima West Middle School, and Lima North Middle School.
Ownership History
Date
Name
Owned For
Owner Type
Purchase Details
Closed on
Sep 10, 2020
Sold by
Honey Run Investments Llc
Bought by
Harris Rickie
Current Estimated Value
Purchase Details
Closed on
Jul 16, 2019
Sold by
Sarven Brian C
Bought by
Honey Run Investments Llc
Purchase Details
Closed on
Sep 16, 1994
Sold by
Simmonds Thomas
Bought by
Smith Marsha
Home Financials for this Owner
Home Financials are based on the most recent Mortgage that was taken out on this home.
Original Mortgage
$2,844
Interest Rate
8.44%
Mortgage Type
New Conventional
Purchase Details
Closed on
Jul 30, 1985
Bought by
Simmonds Thomas D
Create a Home Valuation Report for This Property
The Home Valuation Report is an in-depth analysis detailing your home's value as well as a comparison with similar homes in the area
Home Values in the Area
Average Home Value in this Area
Purchase History
| Date | Buyer | Sale Price | Title Company |
|---|---|---|---|
| Harris Rickie | $10,500 | None Available | |
| Honey Run Investments Llc | $25,000 | None Available | |
| Smith Marsha | $37,500 | -- | |
| Simmonds Thomas D | -- | -- |
Source: Public Records
Mortgage History
| Date | Status | Borrower | Loan Amount |
|---|---|---|---|
| Previous Owner | Smith Marsha | $2,844 |
Source: Public Records
Tax History Compared to Growth
Tax History
| Year | Tax Paid | Tax Assessment Tax Assessment Total Assessment is a certain percentage of the fair market value that is determined by local assessors to be the total taxable value of land and additions on the property. | Land | Improvement |
|---|---|---|---|---|
| 2024 | $776 | $20,270 | $2,870 | $17,400 |
| 2023 | $778 | $17,780 | $2,520 | $15,260 |
| 2022 | $782 | $17,780 | $2,520 | $15,260 |
| 2021 | $828 | $17,780 | $2,520 | $15,260 |
| 2020 | $1,425 | $14,910 | $2,450 | $12,460 |
| 2019 | $1,425 | $14,910 | $2,450 | $12,460 |
| 2018 | $779 | $14,910 | $2,450 | $12,460 |
| 2017 | $790 | $14,910 | $2,450 | $12,460 |
| 2016 | $800 | $14,910 | $2,450 | $12,460 |
| 2015 | $861 | $14,910 | $2,450 | $12,460 |
| 2014 | $861 | $15,890 | $2,590 | $13,300 |
| 2013 | $839 | $15,890 | $2,590 | $13,300 |
Source: Public Records
Map
Nearby Homes
- 1120 Richie Ave
- 1206 Rice Ave
- 1023 Leland Ave
- 1036 W High St
- 618 Woodward Ave
- 1517 Allentown Rd
- 621 Fairfield Dr
- 648 Hazel Ave
- 631 Hazel Ave
- 638 Hazel Ave
- 676 Cortlandt Ave
- 745 Brice Ave
- 120 S Woodlawn Ave
- 233 S Kenilworth Ave
- 1703 W Wayne St
- 1459 W Market St
- 576 Cortlandt Ave
- 0 Sherman Ave
- 612 N Metcalf St
- 627 Brice Ave