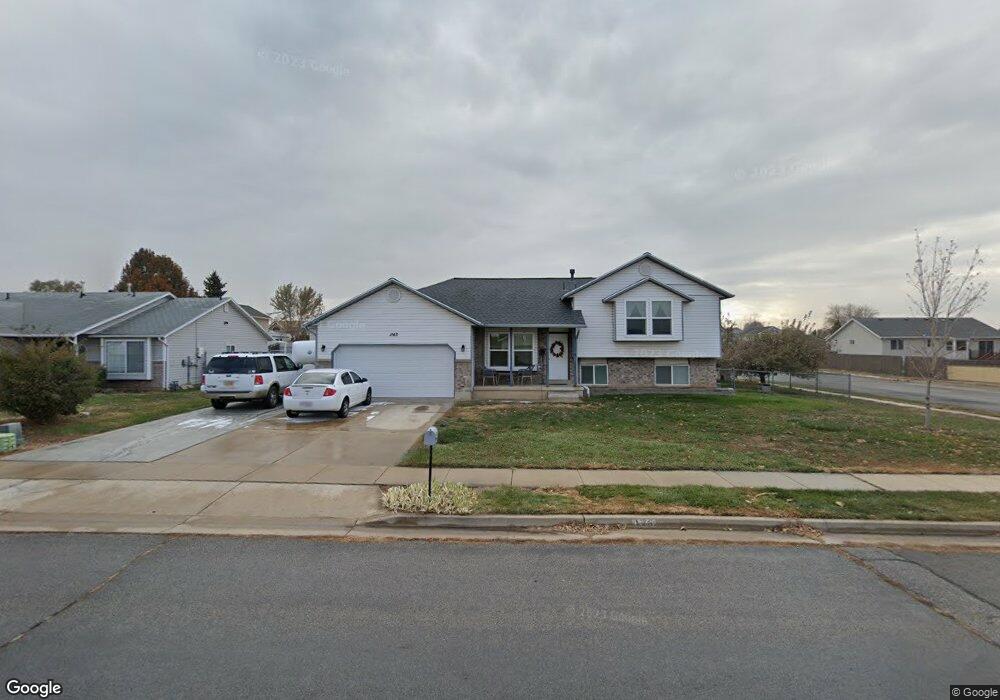
1143 W 1640 N Clearfield, UT 84015
Estimated Value: $436,000 - $501,000
5
Beds
2
Baths
2,195
Sq Ft
$212/Sq Ft
Est. Value
About This Home
This home is located at 1143 W 1640 N, Clearfield, UT 84015 and is currently estimated at $464,820, approximately $211 per square foot. 1143 W 1640 N is a home located in Davis County with nearby schools including Clinton Elementary School, Sunset Junior High School, and Clearfield High School.
Ownership History
Date
Name
Owned For
Owner Type
Purchase Details
Closed on
Mar 23, 2016
Sold by
Loveland Derek T and Loveland Maile
Bought by
Loveland Derek T and Loveland Maile
Current Estimated Value
Purchase Details
Closed on
Sep 28, 2005
Sold by
Smith Mark H and Smith Debby J
Bought by
Loveland Derek T and Loveland Maile
Home Financials for this Owner
Home Financials are based on the most recent Mortgage that was taken out on this home.
Original Mortgage
$163,435
Outstanding Balance
$86,723
Interest Rate
5.72%
Mortgage Type
FHA
Estimated Equity
$378,097
Purchase Details
Closed on
Aug 19, 1999
Sold by
Greener Benjamin R
Bought by
Smith Mark H and Smith Debby J
Home Financials for this Owner
Home Financials are based on the most recent Mortgage that was taken out on this home.
Original Mortgage
$142,037
Interest Rate
7.63%
Mortgage Type
VA
Create a Home Valuation Report for This Property
The Home Valuation Report is an in-depth analysis detailing your home's value as well as a comparison with similar homes in the area
Home Values in the Area
Average Home Value in this Area
Purchase History
| Date | Buyer | Sale Price | Title Company |
|---|---|---|---|
| Loveland Derek T | -- | Lincoln Title | |
| Loveland Derek T | -- | -- | |
| Smith Mark H | -- | Equity Title Agency |
Source: Public Records
Mortgage History
| Date | Status | Borrower | Loan Amount |
|---|---|---|---|
| Open | Loveland Derek T | $163,435 | |
| Previous Owner | Smith Mark H | $142,037 |
Source: Public Records
Tax History Compared to Growth
Tax History
| Year | Tax Paid | Tax Assessment Tax Assessment Total Assessment is a certain percentage of the fair market value that is determined by local assessors to be the total taxable value of land and additions on the property. | Land | Improvement |
|---|---|---|---|---|
| 2025 | $2,385 | $229,350 | $85,976 | $143,374 |
| 2024 | $2,299 | $222,200 | $94,491 | $127,709 |
| 2023 | $2,046 | $366,000 | $107,532 | $258,468 |
| 2022 | $2,196 | $217,250 | $65,749 | $151,501 |
| 2021 | $2,017 | $296,000 | $82,358 | $213,642 |
| 2020 | $1,749 | $254,000 | $70,005 | $183,995 |
| 2019 | $1,698 | $241,000 | $81,761 | $159,239 |
| 2018 | $1,578 | $220,000 | $69,052 | $150,948 |
| 2016 | $1,407 | $101,255 | $26,894 | $74,361 |
| 2015 | $1,347 | $92,180 | $26,894 | $65,286 |
| 2014 | $1,279 | $88,954 | $26,894 | $62,060 |
| 2013 | -- | $85,625 | $27,143 | $58,482 |
Source: Public Records
Map
Nearby Homes