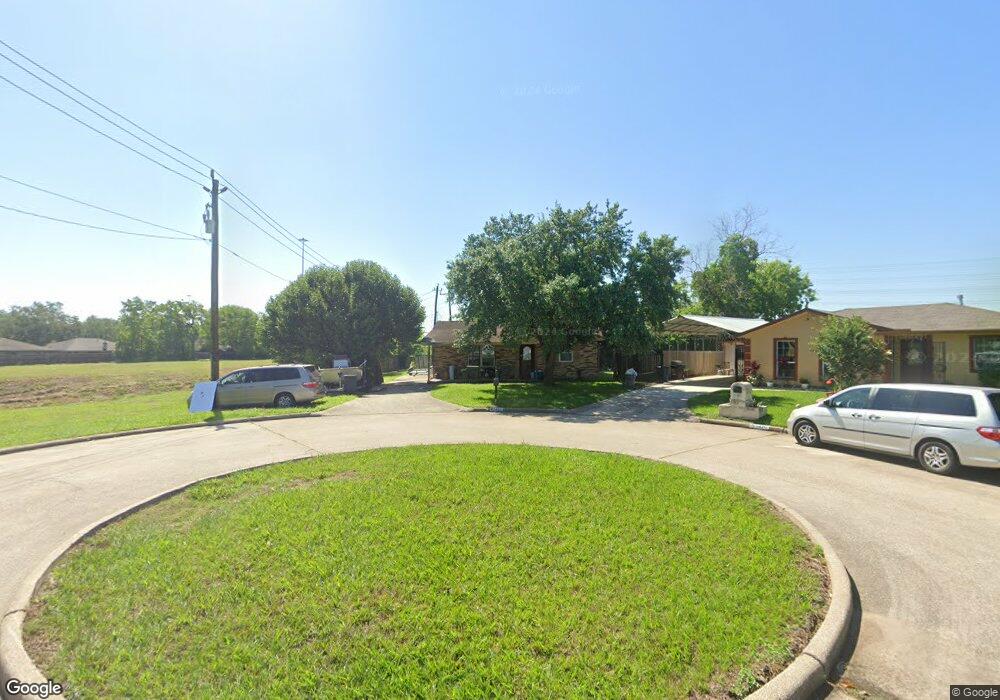
11430 Sagemist Ln Houston, TX 77089
Southbelt-Ellington NeighborhoodEstimated Value: $212,000 - $242,000
3
Beds
2
Baths
1,237
Sq Ft
$181/Sq Ft
Est. Value
About This Home
This home is located at 11430 Sagemist Ln, Houston, TX 77089 and is currently estimated at $224,275, approximately $181 per square foot. 11430 Sagemist Ln is a home located in Harris County with nearby schools including Moore Elementary School, Morris Middle School, and Beverly Hill Intermediate School.
Ownership History
Date
Name
Owned For
Owner Type
Purchase Details
Closed on
Jun 14, 2000
Sold by
Walker William and Walker Bari R
Bought by
Ayala Luis and Contreras Rubia P
Current Estimated Value
Home Financials for this Owner
Home Financials are based on the most recent Mortgage that was taken out on this home.
Original Mortgage
$74,461
Outstanding Balance
$26,400
Interest Rate
8.3%
Mortgage Type
FHA
Estimated Equity
$197,875
Purchase Details
Closed on
Jun 6, 1994
Sold by
Affiliates Fairfield
Bought by
Walker William and Walker Bari R
Home Financials for this Owner
Home Financials are based on the most recent Mortgage that was taken out on this home.
Original Mortgage
$47,500
Interest Rate
8.23%
Purchase Details
Closed on
Nov 2, 1993
Sold by
Best Stephen R
Bought by
Affiliates Fairfield
Create a Home Valuation Report for This Property
The Home Valuation Report is an in-depth analysis detailing your home's value as well as a comparison with similar homes in the area
Home Values in the Area
Average Home Value in this Area
Purchase History
| Date | Buyer | Sale Price | Title Company |
|---|---|---|---|
| Ayala Luis | -- | Stewart Title | |
| Walker William | -- | -- | |
| Affiliates Fairfield | -- | -- |
Source: Public Records
Mortgage History
| Date | Status | Borrower | Loan Amount |
|---|---|---|---|
| Open | Ayala Luis | $74,461 | |
| Previous Owner | Walker William | $47,500 |
Source: Public Records
Tax History Compared to Growth
Tax History
| Year | Tax Paid | Tax Assessment Tax Assessment Total Assessment is a certain percentage of the fair market value that is determined by local assessors to be the total taxable value of land and additions on the property. | Land | Improvement |
|---|---|---|---|---|
| 2025 | $2,848 | $178,937 | $44,280 | $134,657 |
| 2024 | $2,848 | $183,888 | $44,280 | $139,608 |
| 2023 | $2,848 | $183,888 | $44,280 | $139,608 |
| 2022 | $4,002 | $168,255 | $44,280 | $123,975 |
| 2021 | $3,849 | $144,404 | $44,280 | $100,124 |
| 2020 | $3,918 | $143,358 | $44,280 | $99,078 |
| 2019 | $3,895 | $136,445 | $36,900 | $99,545 |
| 2018 | $869 | $127,648 | $37,575 | $90,073 |
| 2017 | $3,288 | $127,648 | $37,575 | $90,073 |
| 2016 | $2,989 | $114,747 | $37,575 | $77,172 |
| 2015 | $2,084 | $101,120 | $26,303 | $74,817 |
| 2014 | $2,084 | $98,356 | $22,545 | $75,811 |
Source: Public Records
Map
Nearby Homes
- 10406 Sagestar Ln
- 11414 Kirkwyn Dr
- 10410 Sagestar Ln
- 10411 Sagewillow Ln
- 10415 Sagewillow Ln
- 10519 Sagepark Ln
- 9743 Santa Monica Blvd
- 10810 Kirkbend Dr
- 9711 Ebb St
- 11311 Caribbean Ln
- 11303 Caribbean Ln
- 10702 Sagewillow Ln
- 10906 Keese Dr
- 10518 Sageburrow Dr
- 9039 Kirkland Dr
- 10427 Sagebluff Dr
- 10510 Sagebluff Dr
- 10731 Sageberry Dr
- 11107 Kirkpark Dr
- 10543 Sagecanyon Dr
- 11426 Sagemist Ln
- 11422 Sagemist Ln
- 11418 Sagemist Ln
- 9602 Sagemist Ct
- 11414 Sagemist Ln
- 9606 Sagemist Ct
- 11426 Newton St
- 11410 Sagemist Ln
- 11430 Newton St
- 11434 Newton St
- 11418 Newton St
- 11438 Newton St
- 11406 Sagemist Ln
- 9611 Sagemist Ct
- 11414 Newton St
- 11442 Newton St
- 9607 Sagemist Ct
- 11410 Newton St
- 11402 Sagemist Ln
- 9603 Sagemist Ct