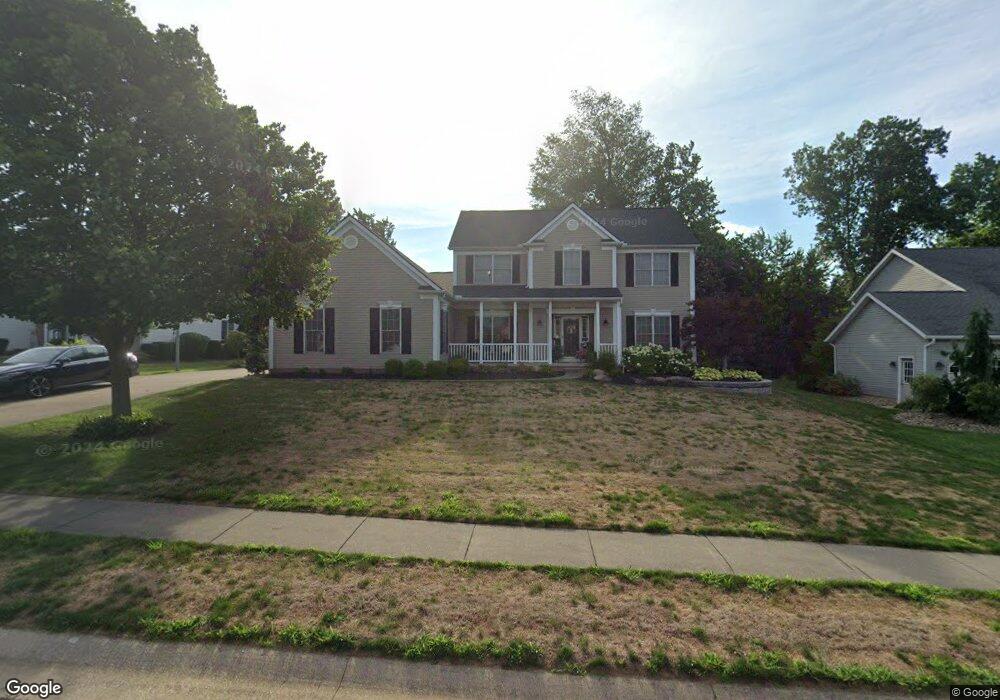
11434 Forest Meadows Cir NW Uniontown, OH 44685
Estimated Value: $423,000 - $526,000
4
Beds
4
Baths
2,250
Sq Ft
$213/Sq Ft
Est. Value
About This Home
This home is located at 11434 Forest Meadows Cir NW, Uniontown, OH 44685 and is currently estimated at $479,731, approximately $213 per square foot. 11434 Forest Meadows Cir NW is a home located in Stark County with nearby schools including Lake Middle/High School, Lake Center Christian School, and Mayfair Christian School.
Ownership History
Date
Name
Owned For
Owner Type
Purchase Details
Closed on
Apr 4, 2005
Sold by
Dutch Heritage Homes Inc
Bought by
Testa Michael Charles and Testa Denise Marie
Current Estimated Value
Home Financials for this Owner
Home Financials are based on the most recent Mortgage that was taken out on this home.
Original Mortgage
$183,920
Outstanding Balance
$95,526
Interest Rate
5.88%
Mortgage Type
Purchase Money Mortgage
Estimated Equity
$384,205
Purchase Details
Closed on
Oct 6, 2003
Sold by
Chatham Development Corp
Bought by
Dutch Heritage Homes Inc
Home Financials for this Owner
Home Financials are based on the most recent Mortgage that was taken out on this home.
Original Mortgage
$185,175
Interest Rate
6.4%
Mortgage Type
Construction
Create a Home Valuation Report for This Property
The Home Valuation Report is an in-depth analysis detailing your home's value as well as a comparison with similar homes in the area
Home Values in the Area
Average Home Value in this Area
Purchase History
| Date | Buyer | Sale Price | Title Company |
|---|---|---|---|
| Testa Michael Charles | $229,900 | Land America-Lawyers Title | |
| Dutch Heritage Homes Inc | $60,900 | -- |
Source: Public Records
Mortgage History
| Date | Status | Borrower | Loan Amount |
|---|---|---|---|
| Open | Testa Michael Charles | $183,920 | |
| Closed | Dutch Heritage Homes Inc | $185,175 | |
| Closed | Testa Michael Charles | $34,480 |
Source: Public Records
Tax History Compared to Growth
Tax History
| Year | Tax Paid | Tax Assessment Tax Assessment Total Assessment is a certain percentage of the fair market value that is determined by local assessors to be the total taxable value of land and additions on the property. | Land | Improvement |
|---|---|---|---|---|
| 2025 | -- | $176,580 | $41,650 | $134,930 |
| 2024 | -- | $176,580 | $41,650 | $134,930 |
| 2023 | $5,780 | $112,920 | $26,920 | $86,000 |
| 2022 | $5,800 | $112,920 | $26,920 | $86,000 |
| 2021 | $5,862 | $112,920 | $26,920 | $86,000 |
| 2020 | $5,415 | $93,180 | $23,210 | $69,970 |
| 2019 | $5,372 | $94,330 | $23,210 | $71,120 |
| 2018 | $5,443 | $94,330 | $23,210 | $71,120 |
| 2017 | $5,248 | $84,150 | $20,690 | $63,460 |
| 2016 | $5,258 | $84,150 | $20,690 | $63,460 |
| 2015 | $5,258 | $84,150 | $20,690 | $63,460 |
| 2014 | $702 | $77,320 | $19,810 | $57,510 |
| 2013 | $2,370 | $77,950 | $19,810 | $58,140 |
Source: Public Records
Map
Nearby Homes
- 3863 Heckman St NW
- 3475 Heckman St NW
- 3851 Cromford Cir NW
- 11316 Cleveland Ave NW
- 11056 Peach Glen Ave NW
- 11065 Dunsby Ave NW
- 0 Heckman St NW Unit 5154708
- 3620 Cain St NW
- 10531 Newbury Ave NW
- 3048 Wright Rd NW
- 10380 Sudbury Cir NW
- Sarasota Plan at Spring Hill - Spring Hill Villas
- Chester Plan at Spring Hill - Spring Hill Villas
- Kenai Plan at Spring Hill - Spring Hill Villas
- Holston Plan at Spring Hill - Spring Hill Villas
- Bradbern Plan at Spring Hill - Spring Hill Villas
- Northwood Plan at Spring Hill - Spring Hill Villas
- 12235 Cantburg Ave NW
- 3212 Deborah Ct
- 4786 Mayfair Rd
- 11416 Forest Meadows Cir NW
- 11454 Forest Meadows Cir NW
- 11478 Forest Meadows Cir NW
- 11435 Forest Meadows Cir NW
- 11417 Forest Meadows Cir NW
- 11451 Forest Meadows Cir NW
- 11395 Forest Meadows Cir NW
- 11492 Forest Meadows Cir NW
- 11467 Forest Meadows Cir NW
- 11479 Forest Meadows Cir NW
- 11504 Forest Meadows Cir NW
- 11452 Peach Glen Ave NW
- 11472 Peach Glen Ave NW
- 11489 Forest Meadows Cir NW
- 11430 Peach Glen Ave NW
- 3690 Heckman St NW
- 3728 Heckman St NW
- 11412 Peach Glen Ave NW
- 11501 Forest Meadows Cir NW
- 3746 Heckman St NW