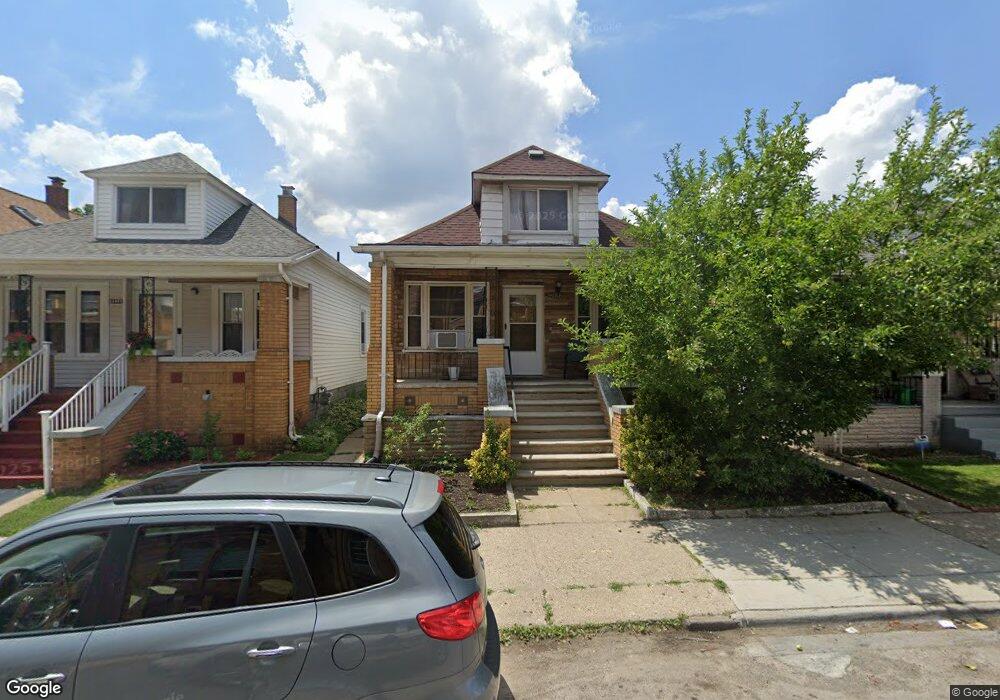
11435 Charest St HamtraMcK, MI 48212
Estimated Value: $214,000 - $314,000
Studio
--
Bath
1,690
Sq Ft
$153/Sq Ft
Est. Value
About This Home
This home is located at 11435 Charest St, HamtraMcK, MI 48212 and is currently estimated at $259,121, approximately $153 per square foot. 11435 Charest St is a home located in Wayne County with nearby schools including Dickinson East Elementary School, Kosciuszko Middle School, and Hamtramck High School.
Ownership History
Date
Name
Owned For
Owner Type
Purchase Details
Closed on
Mar 28, 2014
Sold by
Sattar Abdus
Bought by
Sattar Abdus
Current Estimated Value
Purchase Details
Closed on
Sep 5, 2007
Sold by
Mtglq Investors Lp
Bought by
Mutalib Abdul
Purchase Details
Closed on
Jul 13, 2006
Sold by
White Odetta
Bought by
Mtglq Investors Lp
Purchase Details
Closed on
Jun 23, 2005
Sold by
Easter Eric and Easter T E
Bought by
White Odetta
Purchase Details
Closed on
Jun 26, 2003
Sold by
Tomczyk Waldemar
Bought by
Household Finance Corp Iii
Create a Home Valuation Report for This Property
The Home Valuation Report is an in-depth analysis detailing your home's value as well as a comparison with similar homes in the area
Home Values in the Area
Average Home Value in this Area
Purchase History
| Date | Buyer | Sale Price | Title Company |
|---|---|---|---|
| Sattar Abdus | $50,000 | None Available | |
| Mutalib Abdul | $30,000 | Fidelity National Title Ins | |
| Mtglq Investors Lp | $95,697 | None Available | |
| White Odetta | $95,000 | Wilson Title Agency Llc | |
| Household Finance Corp Iii | $75,200 | -- |
Source: Public Records
Tax History
| Year | Tax Paid | Tax Assessment Tax Assessment Total Assessment is a certain percentage of the fair market value that is determined by local assessors to be the total taxable value of land and additions on the property. | Land | Improvement |
|---|---|---|---|---|
| 2025 | $2,199 | $132,700 | $0 | $0 |
| 2024 | $2,145 | $112,700 | $0 | $0 |
| 2023 | $2,358 | $101,800 | $0 | $0 |
| 2022 | $2,074 | $83,200 | $0 | $0 |
| 2021 | $2,272 | $64,900 | $0 | $0 |
| 2020 | $2,251 | $57,600 | $0 | $0 |
| 2019 | $2,230 | $47,200 | $0 | $0 |
| 2018 | $1,300 | $34,900 | $0 | $0 |
| 2017 | $357 | $16,700 | $0 | $0 |
| 2016 | $817 | $14,800 | $0 | $0 |
| 2015 | $1,410 | $14,100 | $0 | $0 |
| 2013 | $1,420 | $14,200 | $0 | $0 |
| 2012 | $746 | $15,800 | $2,800 | $13,000 |
Source: Public Records
Map
Nearby Homes
- 11655 Mitchell St
- 3031 Trowbridge St
- 11730 Sobieski St
- 11357 Moran St
- 11651 Moran St
- 3193 Trowbridge St
- 11697 Moran St
- 11711 Moran St
- 11809 Conant St
- 3837 Harold St
- 11705 Mackay St
- 12091 Sobieski St
- 12099 Klinger St
- 12140 Mitchell St
- 2978 Evaline St
- 2361 Caniff St
- 3368 Evaline St
- 3929 Caniff St
- 2393 Botsford St
- 11523 Fleming St
- 11441 Charest St
- 11431 Charest St
- 11447 Charest St
- 11423 Charest St
- 11417 Charest St
- 11434 Mcdougall St
- 11442 Mcdougall St
- 11424 Mcdougall St
- 11411 Charest St
- 11446 Mcdougall St
- 11418 Mcdougall St
- 11412 Mcdougall St
- 11452 Mcdougall St
- 3130 Casmere St
- 11405 Charest St
- 11410 Charest St
- 11458 Mcdougall St
- 11410 Mcdougall St
- 11399 Charest St
- 11404 Mcdougall St
Your Personal Tour Guide
Ask me questions while you tour the home.